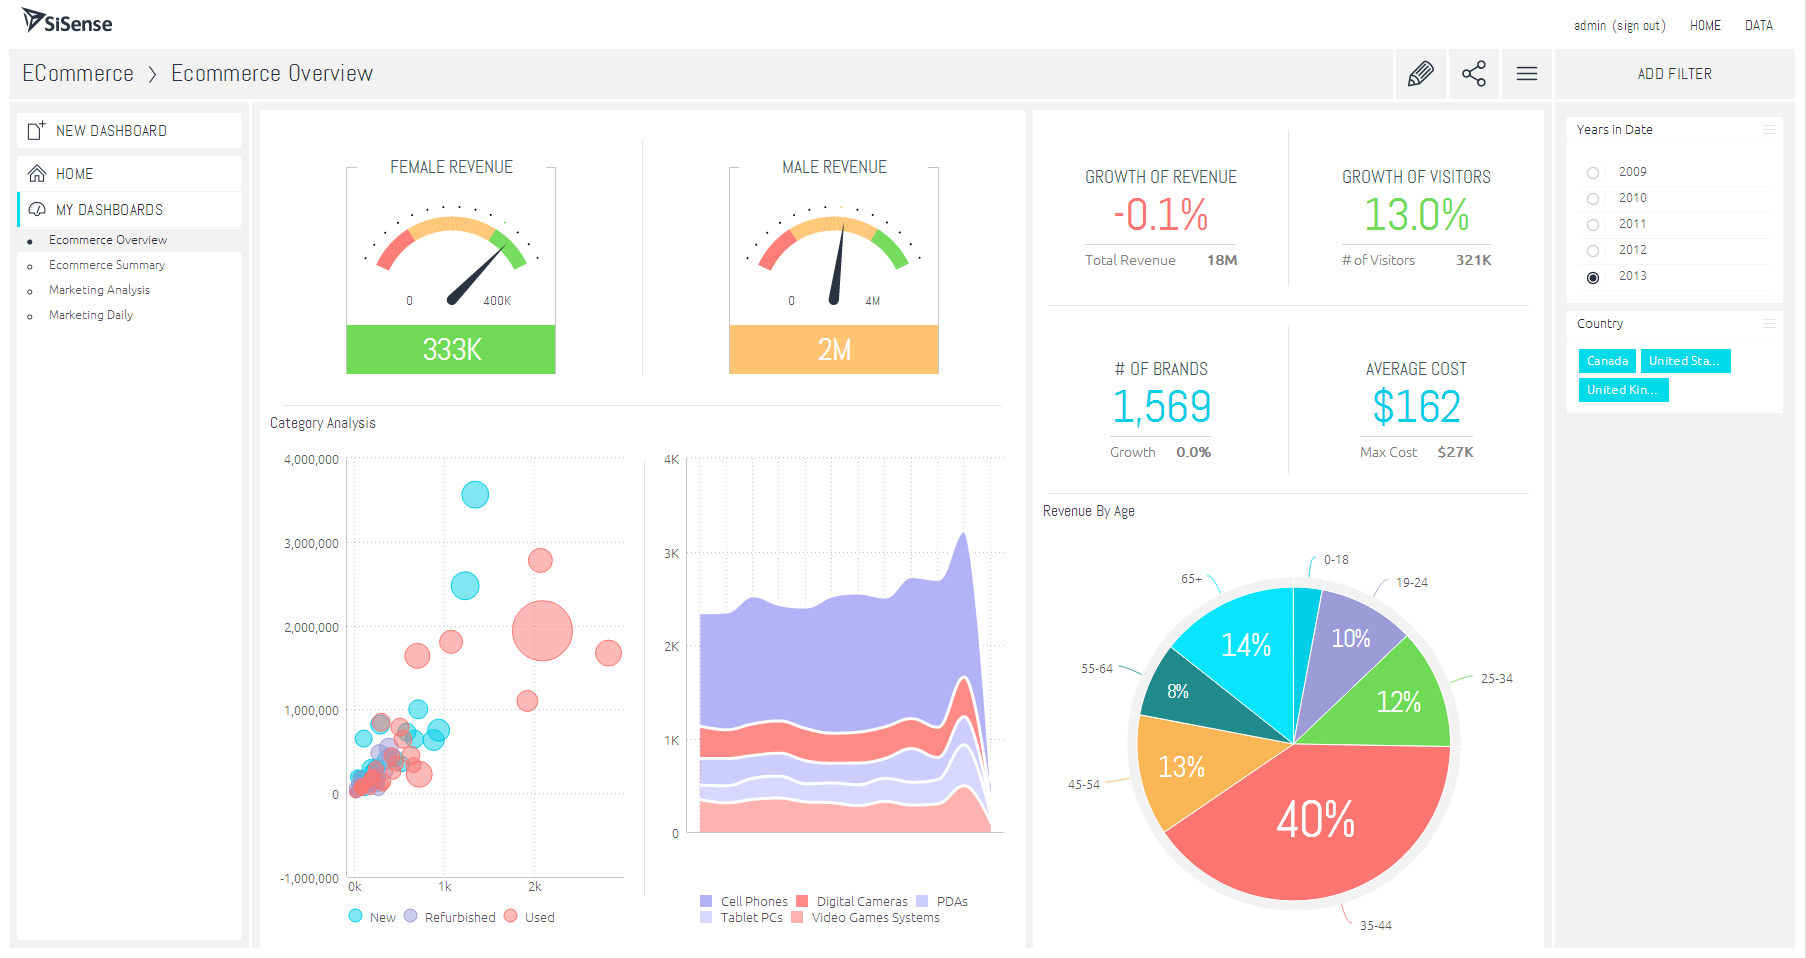
Storydoc approaches data visualization from a storytelling perspective rather than focusing purely on charts and dashboards.
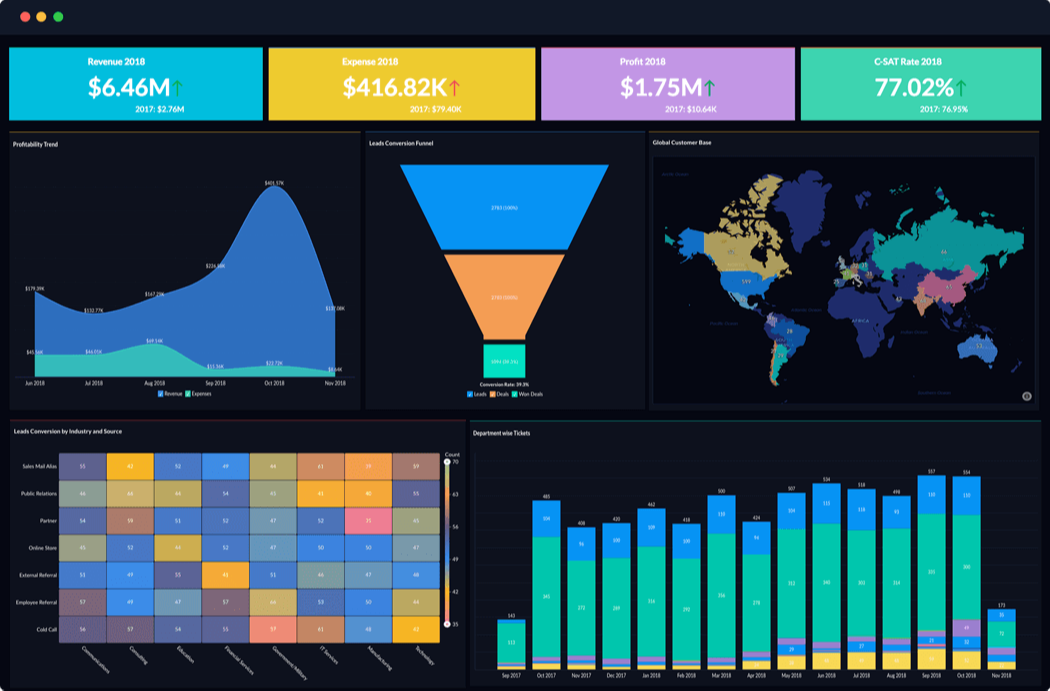
Instead of building standalone charts, our platform lets you embed interactive graphs, infographics, and data visualizations directly inside scrollable presentations and business documents.
This makes it easier to combine data with narrative context, explanations, and calls to action in a single experience.
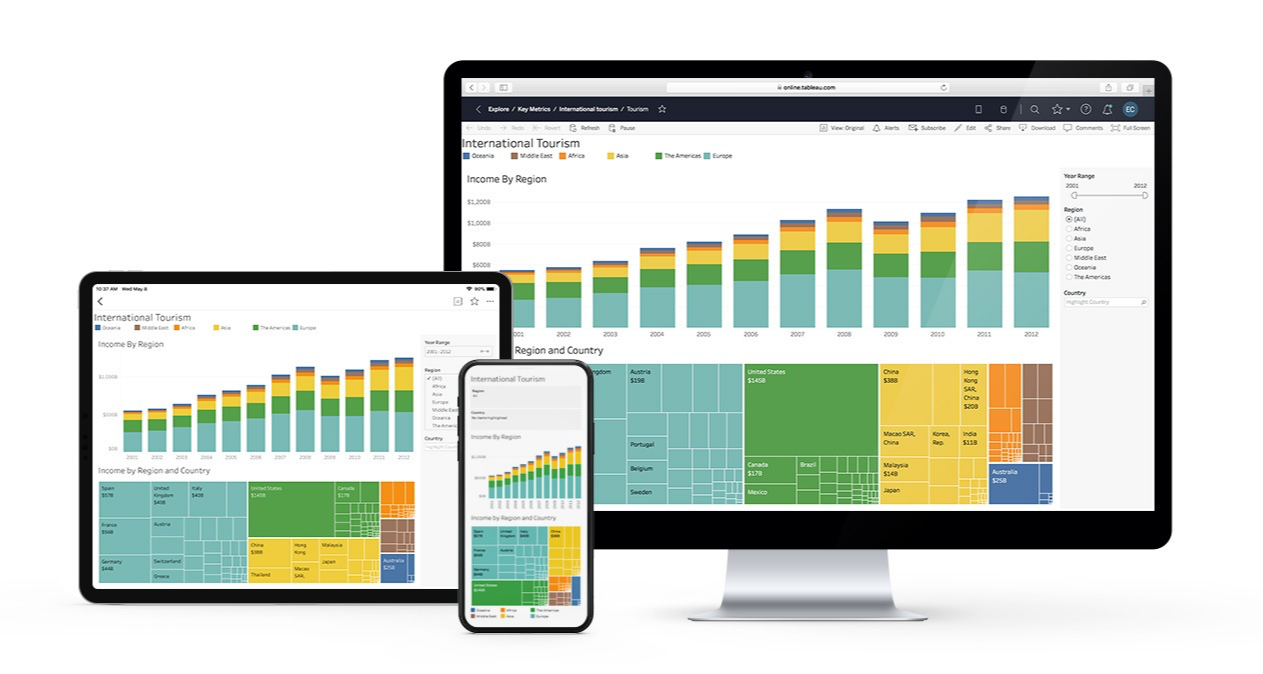
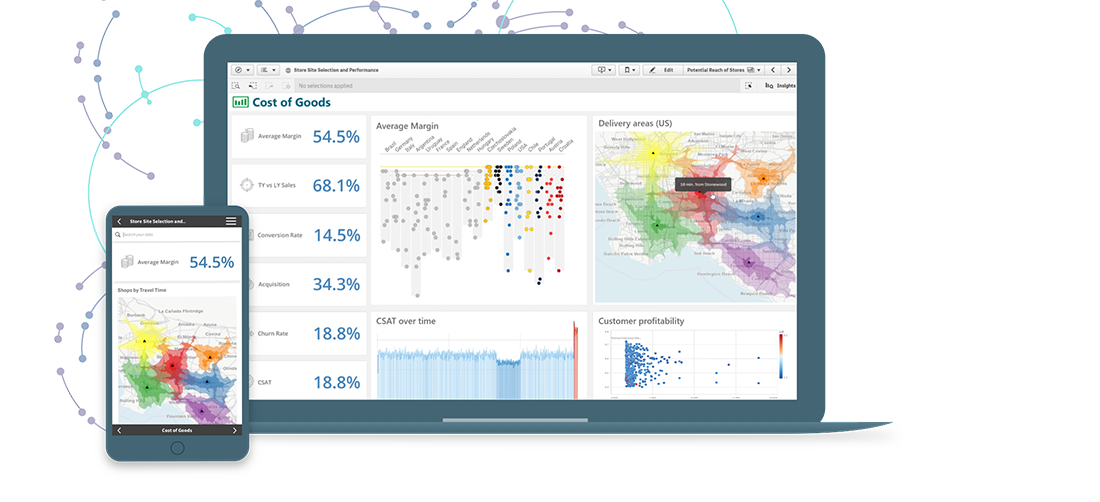
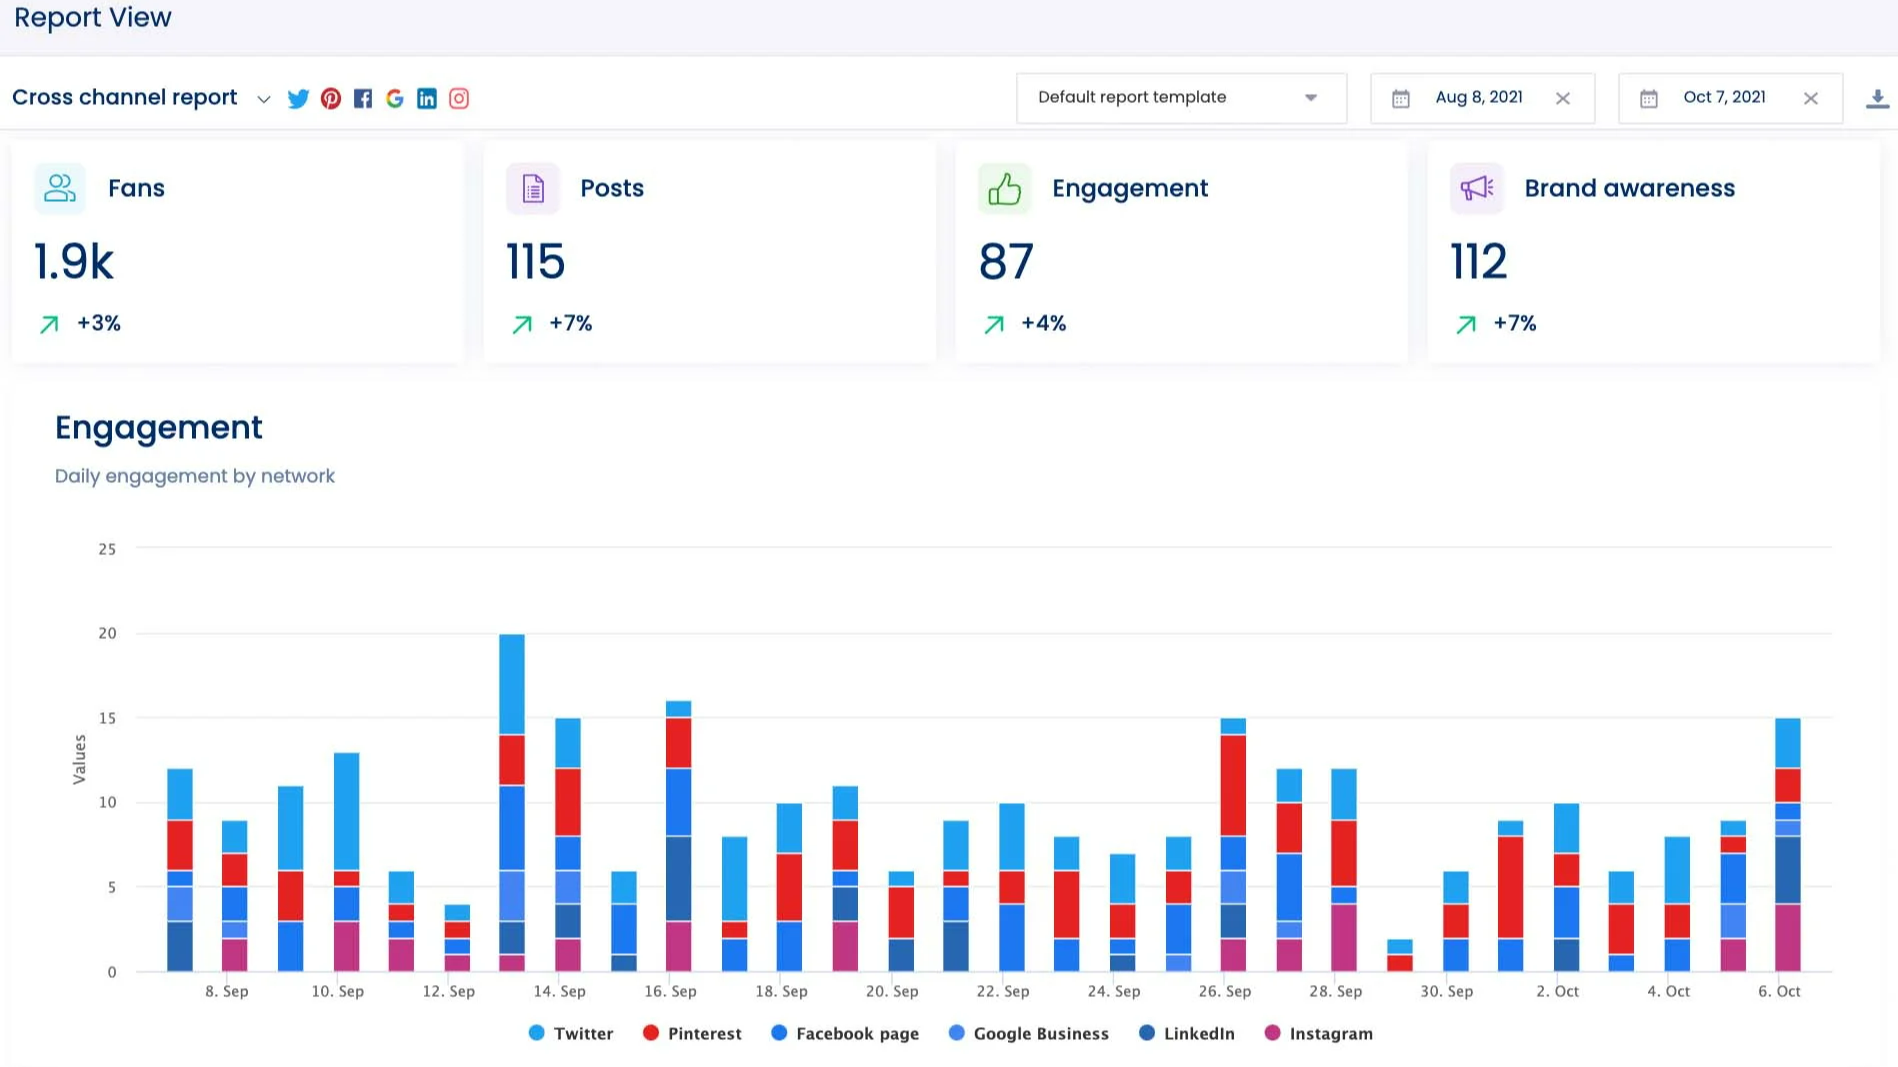
You can also easily switch between different types of data visualizations with one click. They’re all designed with the mobile-first principle in mind to meet the needs of any contemporary business.
Automation also plays an important role. Through native integrations and workflow tools like Zapier and Make, teams can automatically generate reports, proposals, or presentations populated with data from CRM systems or other business tools.
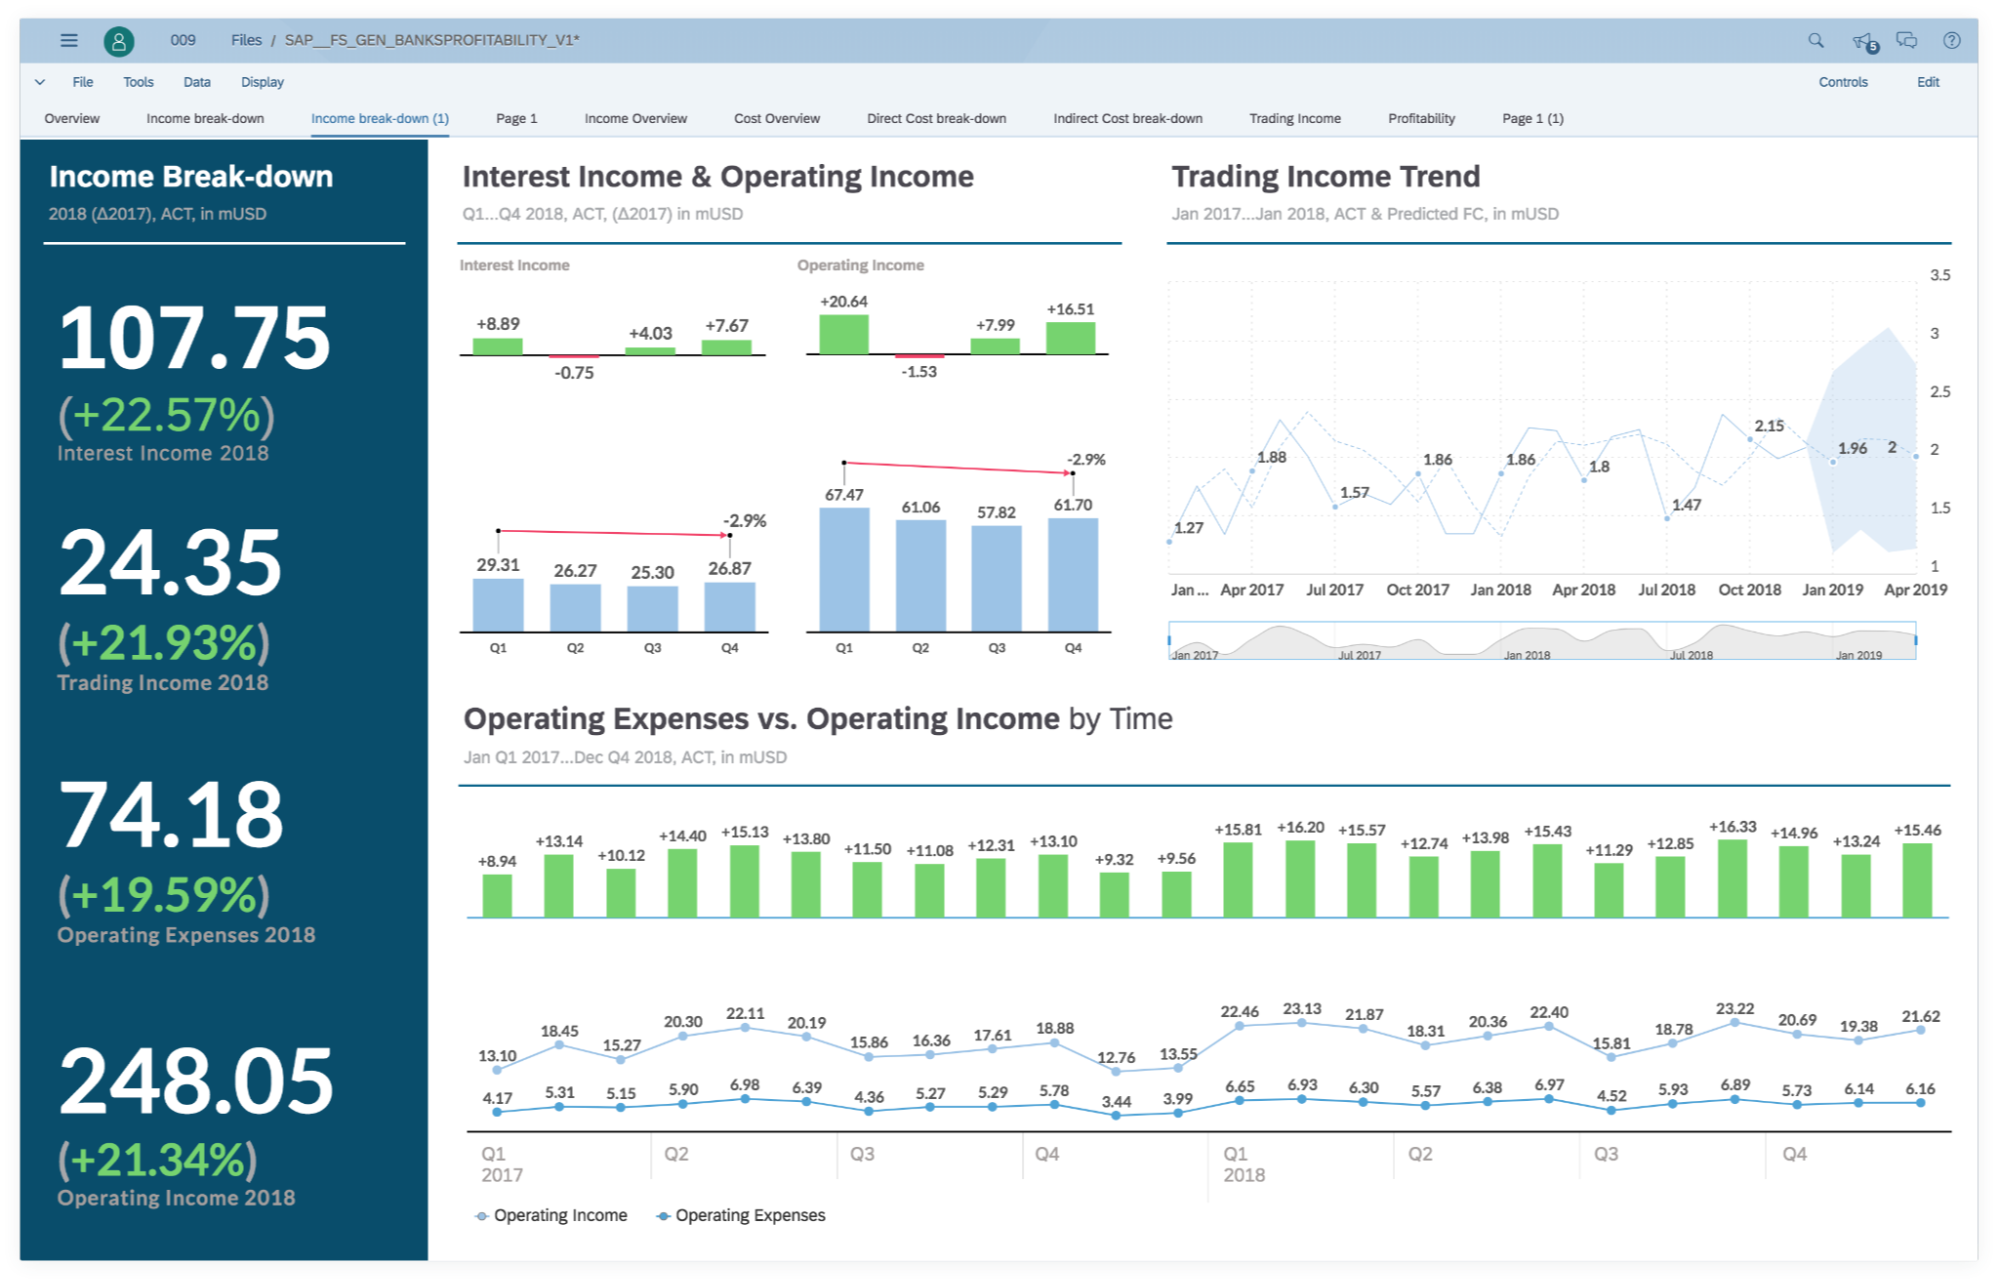
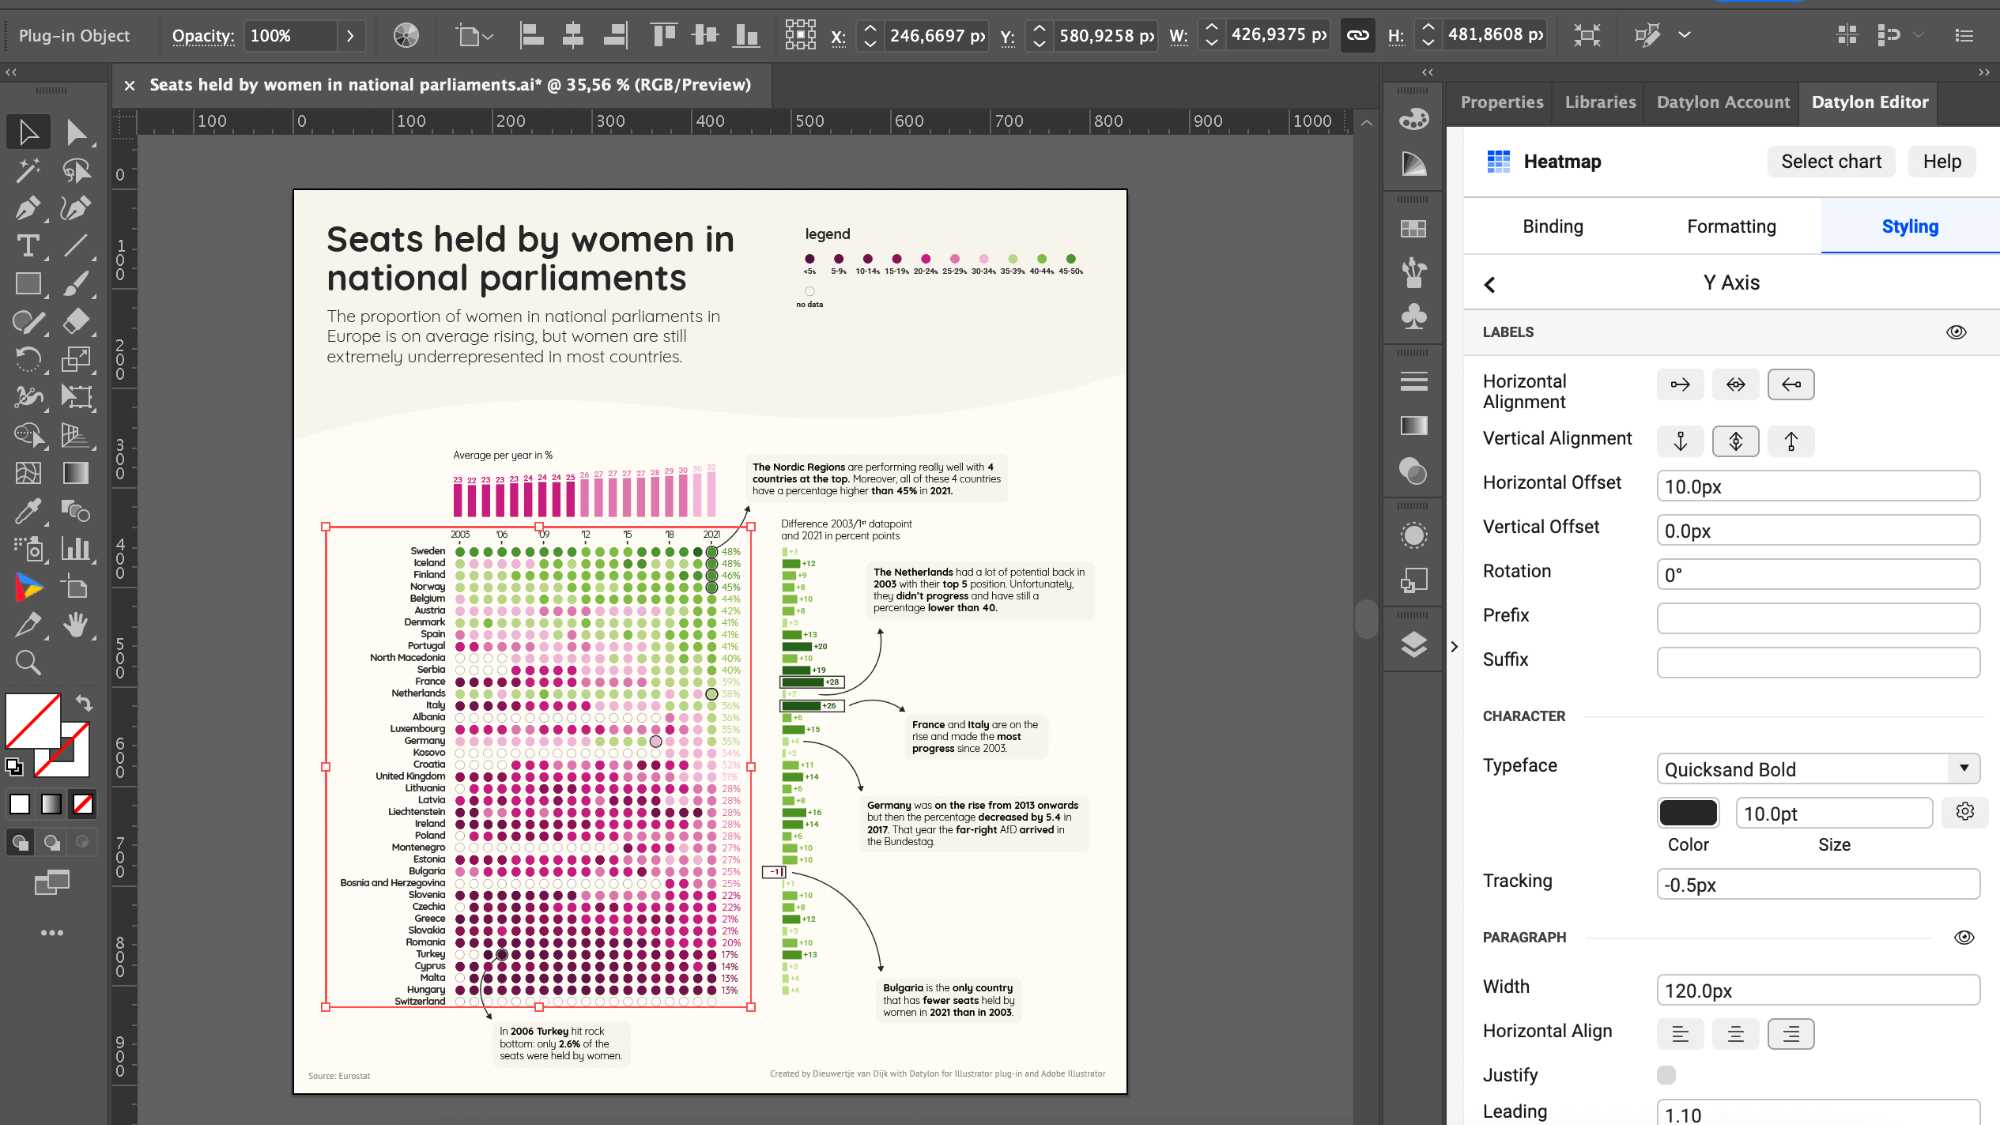
And, you can rest assured that all charts will be 100% on-brand. Define your brand colors, pick a chart from our library, enter the numbers–and let our editor do the rest!
Once your data visualizations are out in the world, we also offer real-time tracking and analytics. This way, you can make business decisions faster and stay ahead of your competition!
Pricing: Our Starter plan starts at $33 per user/month. If you need something more tailored to your needs, get in touch with us. We’ll provide you with pricing information depending on your use case.
Pros:
- Mobile-first designs.
- Library of pre-designed templates for different use cases.
- Unlimited interactive slides.
- Real-time tracking and analytics.
- In the Pro version, you get tailor-made branded templates.
Cons:
- No free version available.
- In the Starter plan, you cannot store assets on your subdomain.
Are you not quite convinced yet? It’s alright. We prepared 3 more options for your business in case you need more time to think.