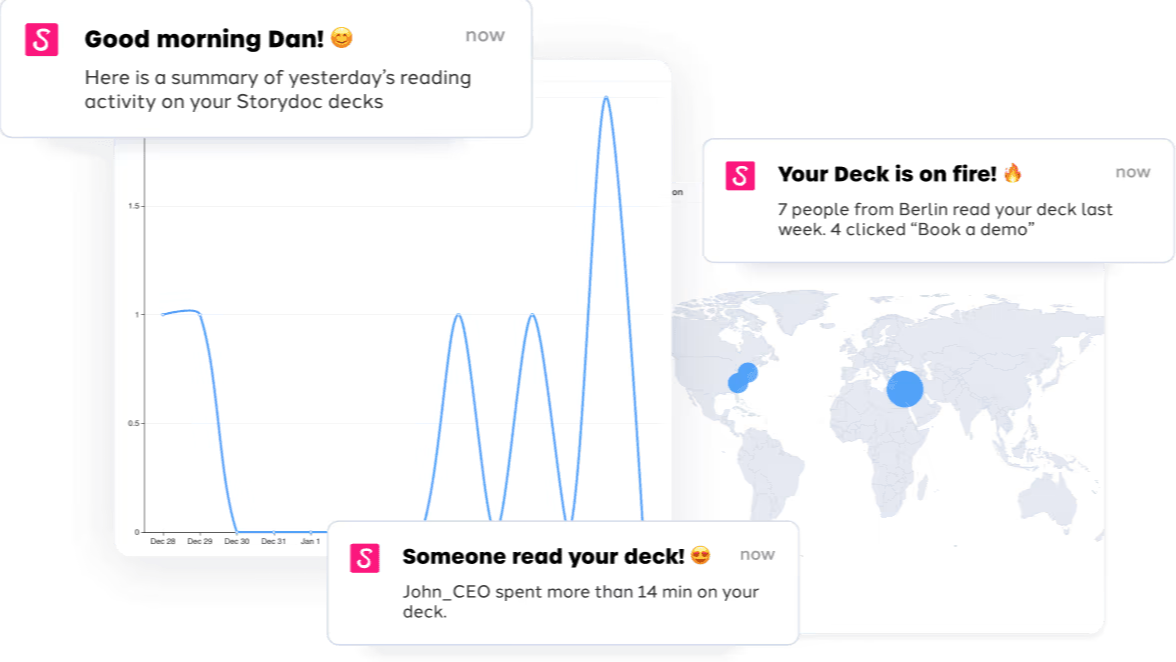

Gain instant visibility into the deal metrics that matter most. Simply send your Storydoc decks and see the dashboard automatically filled up with customer engagement data.
Just watch this short tutorial and you're good to go:
Stop selling blind. Turn the lights on.
Use presentation analytics to get 100% visibility into your deals, before, after and in between meetings. Follow up in the perfect timing with real-time engagement alerts.
Get started with presentation analytics
Gain instant visibility into the deal metrics that matter most. Simply send your Storydoc decks and see the dashboard automatically filled up with customer engagement data.
Just watch this short tutorial and you're good to go:
Once you create your deck, just plug in your customer's name and generate a new version.
From the moment your deck is opened, Storydoc tracks every touchpoint, giving you real-time data on how your content is performing.
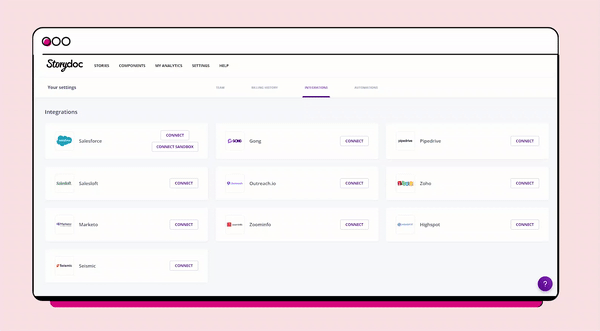
Automatically see the activity on every lead directly on your CRM with our native integrations.
Once you create your deck, just plug in your customer's name and generate a new version.
From the moment your deck is opened, Storydoc tracks every touchpoint, giving you real-time data on how your content is performing.
Automatically see the activity on every lead directly on your CRM with our native integrations.
Behind every deal, there are about 6 to 10 people you need to win over. Almost half of them are invisible to your salespeople. But they're not invisible to your deck.
Thanks to our live updates, you can take a deep dive into every single deal and never miss a beat.
Compare different versions of your deck based on performance and tweak them for the biggest impact.
With Storydoc's CRM data integrations, you can get all that data directly into your CRM and data tools, using it for automated workflows and better predictions.
Uri Gabai
CEO
Doug Ladden
Co-Founder and CEO
Assaf Klinger
CEO
FAQ
You can see how much time prospects spent on each slide, if they have read it all the way down, how many people from the organization looked at it and when, and finally - an engagement score calculated automatically to allow you to know which leads are currently hot.
Absolutely! You can integrate our analytics panel with your existing sales and marketing stack, including tools like Hubspot, Salesforce, Gong, Google Analytics, Marketo, Zoho, and Pipedrive. With your insights in one place, it’s easier than ever to make decisions that maximize your sales performance. Learn more about our integrations here.
You can find all the data in your analytics dashboard. You can filter it out by story title, version title, location, sender, and time frames. Once you have all filters in place, your dashboard will update automatically to always show you real-time data.
Of course! You get automatic email updates about your current reading sessions, as well as live alerts on the engagement score, so you can always follow up at just the right time.
By comparing different versions of the same deck, you can see which one is resonating with your target audience more. As buying decisions are hardly ever made by a single person, if you see that your deck didn’t travel internally, you can tell it missed the mark and improve it. And, finally, you can see where your prospects dropped off. So, for example, if they stopped reading after the Pricing slide, you can follow up with a personalized discount and still win that deal!
Join top teams that already left the dark side: