The State of Pitch Deck Presentations in 2026

We analyzed 1.3 million investor sessions to uncover what gets pitch decks read or ignored. Here’s what actually works now, so you can pitch with confidence.

Pitch deck statistics

helped business
professionals at:

WorkDay IHeart Meta Nice American Cancer Society Xerox

Raising money in 2026 is brutal.

Investors are busier, pickier, and more distracted than ever. They’re opening more decks, scanning faster, and bouncing at record rates. AI-generated pitches flood inboxes, making it harder than ever to stand out - or be taken seriously.

The funding pool is growing - $91 billion was raised in Q2 of 2025 alone - but most of that capital is going to the top.

In fact, a third of all funding in Q2 went to the largest companies. That leaves early-stage founders competing for attention in a market where everyone wants a piece, but only a few get it.

Meanwhile, the volume keeps climbing. On average, 137,000 new startups are launched every day, and 90% of them fail. The ones that survive have a great story, and they know how to tell it.
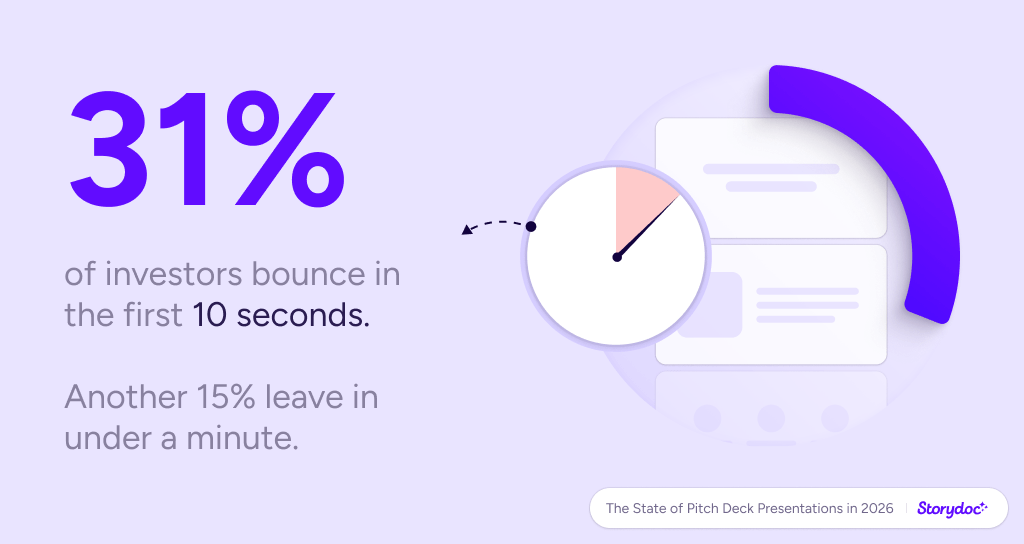
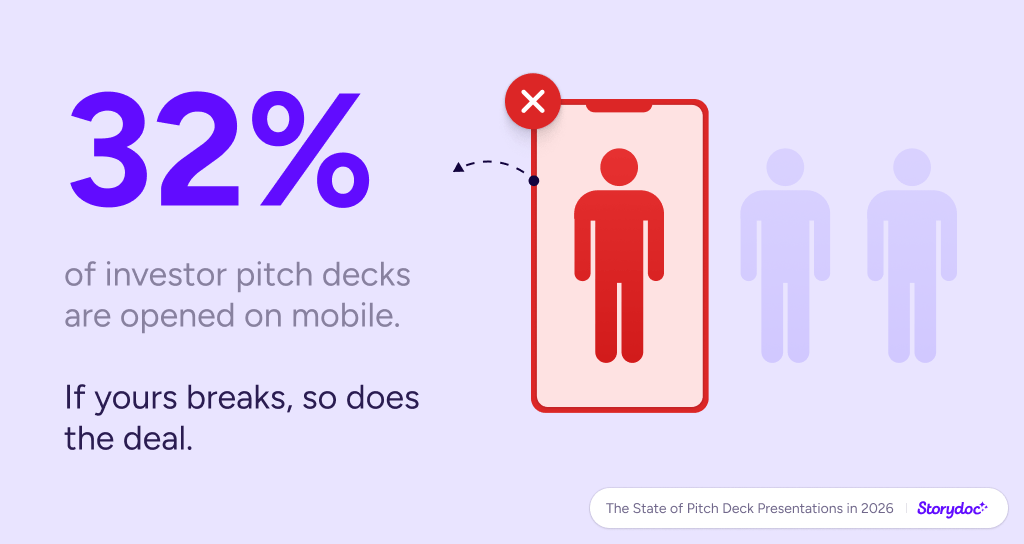
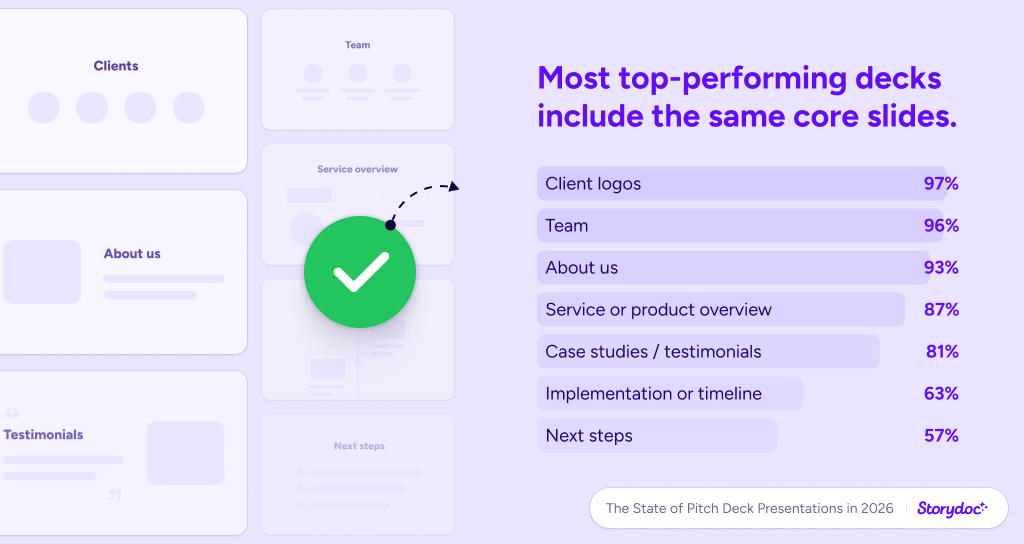
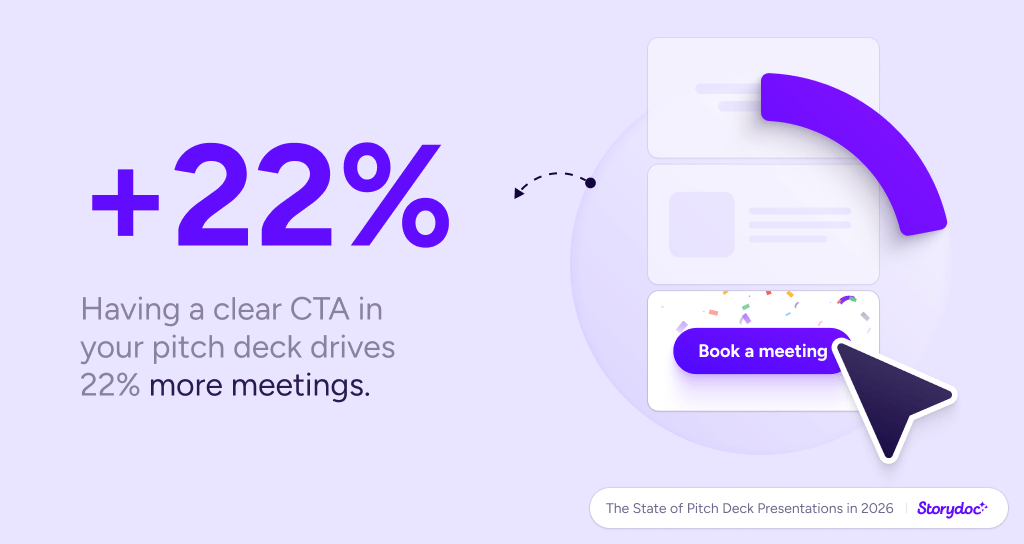
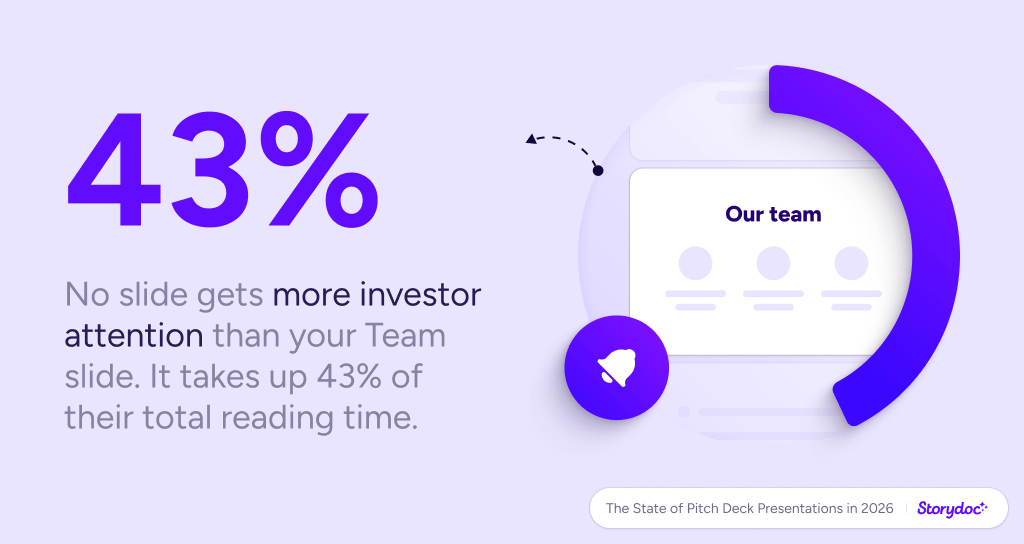
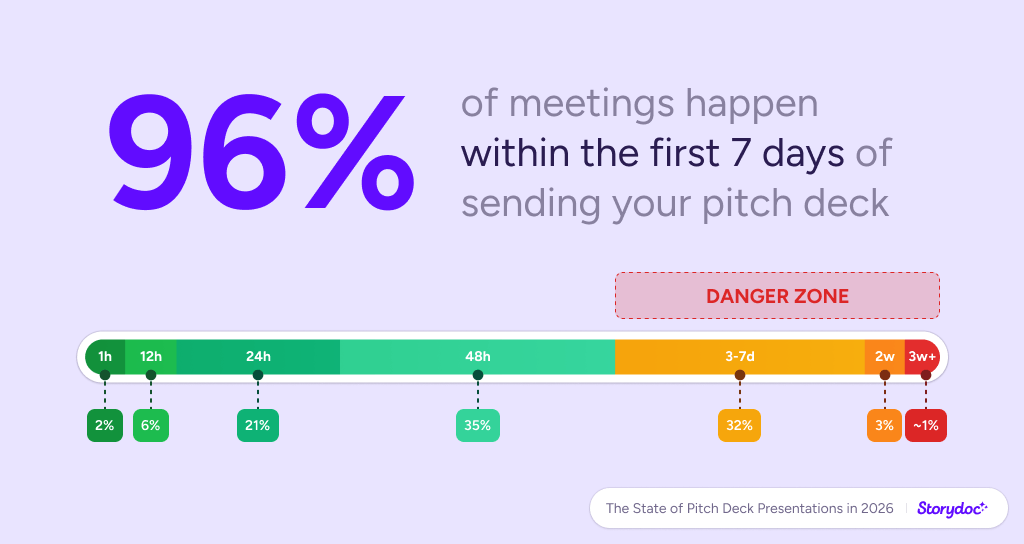
We analyzed over 1.3 million real investor sessions to figure out how they actually engage with decks - what they read, what they skip, and what makes them take action.

This isn’t recycled advice or founder folklore. It’s the reality of pitching in 2026 - and what you need to do to make it through.

1. Most pitch decks still get opened - but that’s where the easy part ends

For all the noise and overwhelm in today’s funding landscape, getting your pitch deck opened isn’t the hard part.

Most decks arrive after a warm intro or a promising first call. You’re not cold-emailing VCs your Slide 1 and hoping for the best.

And the numbers reflect that: 81% of pitch decks are started once opened.

How likely is someone to start reading your deck?

That sounds encouraging, but don’t celebrate just yet. Starting doesn’t mean staying.

Most pitch decks still lose their readers within the first few slides. And in a world of instant judgments and 30-tab Chrome windows, you rarely get a second chance.

Storydoc pitch deck statistics

2. You only have 10 seconds to get their attention

Investors don’t read decks slowly. They don’t ease into them. They open, glance, and decide whether it’s worth continuing - often in less time than it takes to read your first paragraph.

Our data shows that 31% of readers bounce within the first 10 seconds. That’s not a typo. A third of your potential investors are gone before slide two. And another 15% drop off within the first minute.

After that, attention levels off. If you’ve held their focus through the first 60 seconds, you have a real chance of getting read. But those opening moments are pure instinct.

Investors are scanning for signs of confidence, focus, and momentum. If your opening slides don’t communicate that fast, they’re moving on.

Storydoc pitch deck statistics

3. Make it past slide 3, and they’ll hear you out

Once you’ve cleared the first-impression filter, the next milestone is simple: get them to slide four. That’s the magic number.

Across all pitch decks we analyzed, 82% of investors who reach slide 4 finish the entire presentation.

That means the real battle is in those first three slides. And yet, too many founders waste these slides on vague problem statements or a slow-moving "vision" paragraph.

82%

of investors who reach slide 4 read the whole deck

The best pitch decks front-load substance, traction, and credibility. That doesn’t mean cramming your whole pitch into slide two - but it does mean earning trust early.

Lead with a sharp UVP, a market stat that makes you raise your eyebrows, or a problem so painful it’s impossible to ignore.

You don’t need to tell your whole story up front. You just need to convince them it’s worth hearing.

Storydoc pitch deck statistics

4. A third of investors will read your deck on mobile. Most decks still aren't built for it.

On average, 32% of decks are opened on a mobile device. And while mobile readers do spend less time on average than desktop users, the difference isn’t dramatic:

  • Desktop: 4:51 min.

  • Mobile: 3:27 min.

  • Tablet: 3:39 min.

This isn’t casual browsing. Mobile sessions are full reads - often in high-context moments: between meetings, on the train, or late at night when your pitch deck finally surfaces in an investor’s inbox.

Avg. reading time by device:

That means your deck has to work under pressure.

If your layout breaks, your text shrinks to unreadable, or your storytelling relies on animations that don’t work on mobile, you’re burning opportunity.

Your deck needs to land just as well on a phone at 10pm in bed as it does on a 27-inch monitor.

Storydoc pitch deck statistics

5. The ideal deck length? 10 slides (but there's a ceiling too)

There’s a myth that "shorter is always better." Not quite. The truth is more nuanced.

Yes, pitch decks that have around 10 slides have the highest completion rate - 32%, compared to the 22% average. But that doesn’t mean every deck should be 8 slides long. If your story lacks depth, investors will notice - and bounce.

On the other hand, longer decks aren’t winning either. Engagement drops sharply after the 18-slide mark.

Our data shows the optimal range is between 10 and 18 slides.

The reason is that pitch decks used to be companion pieces - something you’d talk through in a room or on a Zoom call. But now, the deck is the pitch. Investors often read it asynchronously, without you there to fill in the gaps.

If it’s too short, you might look unprepared. If it’s too long, it might feel bloated. You must build a self-contained pitch that needs to land fast - without you in the room to explain it.

And remember: most investors reading your deck won’t fund you. That’s just the math. So asking them to sift through 25+ slides before they even decide if you’re a maybe? That’s a high ask.

Make your case clearly, quickly, and respectfully - and don’t exhaust the attention you haven’t earned yet.

Storydoc pitch deck statistics

6. There are 6 slides most top-performing pitch decks have in common

You can’t please every investor with the same pitch.

Some zero in on your business model, others fixate on your team, and some just want to see momentum. Depending on the funding stage and their investment history, they’ll each latch onto something different.

However, we looked at thousands of decks and mapped out which slides consistently show up in the top-performing ones.


Here’s what we found:

  • Client logos: included in 97% of top decks. The fastest way to show traction is to show who’s already using your product.

  • Team: included in 96% of investor pitch decks. It’s one of the most consistently viewed slides - investors want to know who they’re backing, not just what you’re building.

  • About us: included in 93%, even if barely read. Investors typically focus on the solution and business model first, but a short, strong intro helps frame the rest of the story.

  • Service or product overview: 87%. Everyone talks about what they’re building - just make sure it’s tied to value, not just features.

  • Case studies / testimonials: 81%. Nothing builds confidence like proof.

  • Implementation or timeline: 63%. This helps show you’ve thought beyond the prototype and mapped the go-to-market.

  • Next steps: only 57%. This is one of the easiest fixes. Too many decks forget to say what they want the investor to do once they’ve finished reading.

Which slides show up in top-performing pitch decks?

Storydoc pitch deck statistics

You don’t need to follow a rigid formula. But when you leave out the slides that answer investors’ unspoken questions, you force them to fill in the gaps. That’s risky.

They might assume you’re hiding something. Or that you haven’t thought it through.

And with dozens of other decks sitting in their inbox, they won’t stick around to figure it out. They'll just move on to the next founder who made their job easier.

Storydoc pitch deck statistics

7. Decks with a clear CTA get more meetings

One of the most common (and costly) mistakes founders make is ending their pitch with a vague close or a bland “thank you” slide.

This isn’t a school presentation. The end goal isn’t to get someone to read your deck - it’s to raise capital.

Our data shows that decks ending with a clear next step - like “Let’s talk” or “Book a meeting” - resulted in 22% more meetings booked than those without one.

Impact of embedding a calendar in your deck:

Too many founders spend slide after slide making a compelling case for their startup, only to hesitate at the final moment.

They hope the investor will make the first move. But if you don’t spell out exactly what you want, you risk losing momentum you may never get back.


Be clear:

  • Say how much you’re raising

  • Explain what the funds will go toward

  • Show how that capital fuels your next stage of growth

  • And then - crucially - tell them what to do next


Even better, embed your calendar directly in the deck. If they’re interested, they can book a meeting right then and there.

Storydoc pitch deck statistics

8. One slide takes up nearly half of investor attention

Building on the previous data point, we also looked at which slides investors clicked, lingered on, and completely ignored - and the patterns are revealing.

There was one slide that stood out far above the rest: The Team slide.

Across pitch decks, investors spend 43% of their total reading time on this one slide alone. It also gets clicked in 49% of sessions, making it one of the most interacted-with slides in the entire investor pitch deck.

This confirms what many founders underestimate: once investors are interested in your idea, the next thing they care about is who they’re betting on.

Storydoc pitch deck statistics

In contrast, the “About Us” slide is often misunderstood. While it appears in 93% of top-performing decks, it was only viewed in 59% of sessions, with investors spending an average of just 2 seconds on it.

So, why is there such a difference? Well, most “About Us” slides don’t actually say much. They’re filled with vague mission statements and long bios that don’t address what matters at that stage of the pitch.

Investors want to see a clear team story but they want it at the right moment and in the right form. And that’s exactly what the Team slide delivers when done well.


Here’s where investors actually click when evaluating your pitch:

  • Case studies / testimonials - 64% of sessions

  • About us - 59%

  • Solution or product overview - 52%

  • Team - 49%


The pattern is clear: proof first, people next. Once investors believe in the opportunity, they’ll spend serious time deciding if you are the team to pull it off.

Which slides do investors click on when evaluating your pitch?

9. Personalization can boost your odds of getting funded - but only when it’s smart

Every investor sees hundreds of decks a year. If yours feels like it could have been sent to anyone, it’s already at a disadvantage.

Our data shows that when founders include the investor’s name, logo (if applicable), and a short tailored note, engagement increases by 29%.

Storydoc pitch deck statistics

Pitch decks that go a step further - by adapting slides to reflect things like the investor’s preferences or investment portfolio - see a 33% lift. When both are done well, decks perform up to 47% better.

Storydoc pitch deck statistics

But this only works if the personalization is authentic. Investors can quickly spot empty gestures - like a copy-pasted “we admire your firm’s mission” or a portfolio reference that clearly hasn’t been researched.

If your deck could be sent to 20 other firms without changing a word, it’s not tailored - it’s dressed up spam. In these cases, surface-level personalization can damage your credibility, as investors can assume the rest of your execution is just as shallow.

If you’ve already been in touch with the investor, consider adding a slide titled “What we’ve heard from you.”

Summarizing their key concerns or investment focus shows you’ve been listening - and adapting. Decks that include this kind of bespoke slide near the top see 31% more engagement than those that don’t.

Benefits of different types of personalized decks:

10. If a meeting’s going to happen, it’ll happen fast

Timing is everything in fundraising - and most founders don’t realize just how short their window really is.

In our data, 35% of investor meetings were booked within the first 48 hours of the deck being opened. 96% happened within the first week. After that, interest flatlines and responses drop to near zero.

It makes sense. Investors are busy, and your pitch is one of dozens they’ve looked at that week. If they’re excited, they’ll act quickly. If they’re unsure, your deck gets buried under the next 20 in their inbox.

When do investor meetings get booked?

This is where a lot of founders lose the round without realizing it. They wait. They assume silence means the investor is still considering. In reality, the moment has passed.

So treat silence as a signal. If you haven’t heard back within 3 days, follow up. Send a reminder. Offer to answer questions. Reopen the loop.

By week two, if they haven’t responded, it’s almost certainly a pass.

Storydoc pitch deck statistics

And that’s it from us for now!

Want to share our findings? Go for it! All images, animations, and items of data featured in this study are available for reuse. Please, make sure to reference the source and link back to this page to give the authors proper credit.

If you’d like to put these insights into practice, we’ve created a gallery of professionally designed pitch deck templates, built to reflect the findings from this research.

Every slide, flow, and layout was crafted to match how real investors read and evaluate decks today.

You can check out the full gallery here:

No templates found

If you’re looking for more guidance, we’ve also curated some of our most in-depth resources on pitch deck writing, design, and strategy - so you can get funded faster:


And, of course, stay tuned for more fresh data coming up. Fundraising should be guided by knowledge, not guesswork!

Methodology and limitations

This study is based on the behavior of readers across more than 1.3 million pitch deck reading sessions created and shared using Storydoc.

We only included live decks - those that were actually sent to investors - so all insights reflect how real investors and stakeholders interacted with real fundraising materials.

Unless explicitly noted, all comparisons in this analysis are based on decks with a given element versus those without it. For example, decks with a video on the cover were compared directly to those with a static cover.

To ensure accuracy in reading time data, we excluded upper outliers - sessions that lasted unusually long (such as those left open for several hours) - to prevent skewed averages.

The decks in this study came from a wide range of industries and company sizes. Given the scale of the sample, the findings are broadly representative of how pitch decks perform across different sectors and use cases.

Itai Amoza

Hi, I'm Itai, one of Storydoc's co-founders. As a data geek, I couldn't hold myself from jumping into our data and discovering what makes top-performing sales decks so successful. I'm excited by the opportunity to share our findings and contribute to the sales and marketing community!

Engaging decks. Made easy

Create your best pitch deck to date.

Stop losing opportunities to ineffective presentations.
Your new amazing deck is one click away!