The State of Sales Proposals: Top Trends for 2026

We analyzed 1.3 million proposal sessions to reveal what actually works in 2025 and beyond - from open rates to slide order to what gets buyers to sign.

Proposal statistics

helped business
professionals at:

WorkDay IHeart Meta Nice American Cancer Society Xerox

These days, most proposals don’t lose to the competition - they lose to indecision.

A Harvard Business Review study analysing over 2.5 million B2B sales conversations found that 40% to 60% of deals end in no decision at all. Not because buyers are satisfied with the status quo - but because they’re afraid of getting the decision wrong.

When proposals fail, it’s often because buyers are overwhelmed by choices, unsure whether the offer will deliver results, or confused about which package to pick. The more uncertain they feel, the more likely they are to stall - and the deal quietly dies.

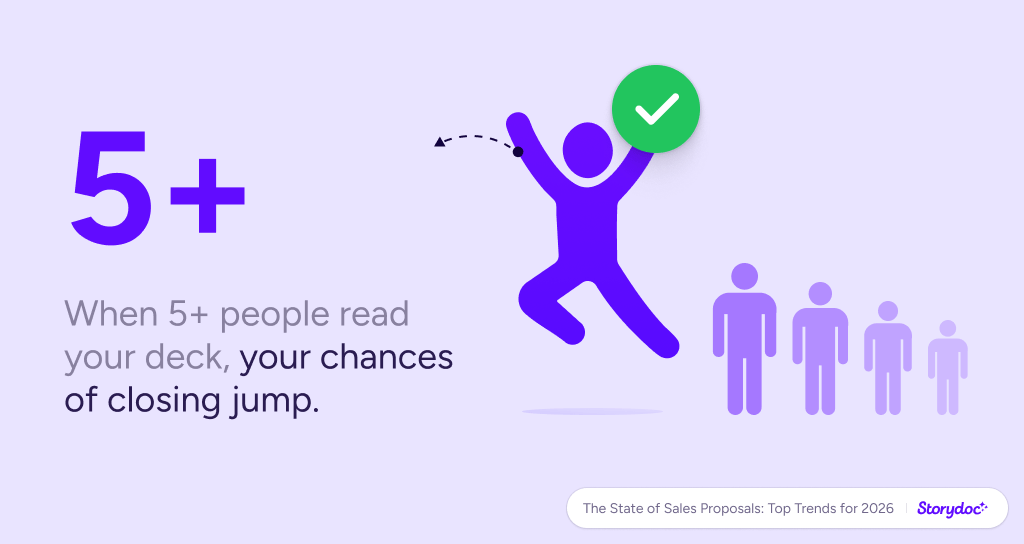
And that missed deal isn’t just a one-time loss. The probability of selling to a new customer is only 5–20%, but once you’ve won the first deal, that number jumps to 60–70%. So every proposal you get right is more than a win - it’s the start of a long-term revenue opportunity.

To understand what actually drives those wins, we analyzed over 1.3 million real proposal sessions sent through Storydoc. We looked at which proposals were opened, which were read, and which got the signature.

Here’s what we found.

1. If your proposal wasn’t opened within 24 hours, it’s time to follow up

If your proposal isn’t opened within the first day, the numbers drop off fast.


Here’s how quickly interest fades:

  • 1 hour from sending: 82% chance your proposal gets read

  • 12 hours: 71%

  • 24 hours: 48%

  • 48 hours: 26%

  • 1 week: 8%

  • 2+ weeks: 2.1%

How likely are people to read your proposal over time?

Storydoc proposal statistics

Buyers who are genuinely interested tend to engage early. If they haven’t opened the deck within 24 hours, you’re no longer top of mind - and by the end of the week, it’s usually a lost cause.

That’s why timing your follow-up is just as important as the proposal itself. Wait too long, and you’re chasing a deal that’s already gone quiet.

Storydoc proposal statistics

2. Most proposals get opened - but don’t celebrate just yet

Across over 1.3 million document sessions, we found clear differences in how likely buyers are to start reading based on what kind of document they receive:

  • Top-of-funnel (brochures, one-pagers): 69%

  • Mid-funnel (pitch decks): 81%

  • Bottom-funnel (proposals): 92%

  • Post-sale content (case studies, product sheets, QBRs): 86%

How likely is someone to start reading your proposal?

This tells us a lot about buyer intent.

Early-stage assets like one-pagers often reach people who are still unsure or exploring. But once they’re reading your proposal, they’re already engaged - and considering buying.

They want to know what working together looks like, how much it costs, and what they need to do next.

If your opening slides don’t match their intent, you’re already losing ground. So don’t waste your first slides recapping everything from the top. Focus on decision-making content, not discovery.

Storydoc proposal statistics

3. You only have 10 seconds to earn their attention

Yes, most proposals get opened, but if you don’t hook people immediately, you’ll lose a third of them before they even reach the second slide.


Our data shows:

  • 31% of buyers bounce within the first 10 seconds

  • Another 15% drop off within the first minute

  • After that, attention levels stabilize - but only if you’ve passed both filters

This means your proposal needs to win twice in the opening moments:

  1. In the first 10 seconds, spark recognition and relevance. A personalized cover slide with their name, company, and a warm note works wonders here.

  2. In the next 60 seconds, deliver momentum. Use visual slides to reinforce value, surface pain points, or highlight clear ROI.


Once you’ve done both, you’ve bought their trust - and earned the right to go deeper. Slides 4–5 onward are where you can finally unpack the details, show pricing, terms, and timelines.

But if you open with a wall of text or vague messaging, you may never make it that far.

In today’s attention economy, it’s not about telling the full story first - it’s about making sure they want to hear the rest.

Storydoc proposal statistics

4. Buyers will finish reading your proposal - but only if they make it to slide 4

Across all proposals we analyzed, 82% of readers who reached slide 4 went on to complete the entire deck.

That means your first 3 slides carry a huge amount of weight. This is where buyers decide whether to keep going or quietly exit.

82%

of buyers who reach slide 4 read the whole deck

Modern B2B buyers are highly self-directed. On average, they spend around 70% of their buying journey creating a shortlist of vendors, and 81% already have a favorite in mind before ever contacting a sales rep.

So by the time they reach your proposal, they’ve often already read your website, clicked through your product pages, and compared you to other providers.

That’s why repeating generic value statements or dry company facts won’t work here.

Use the opening slides to show that this proposal was created for them specifically - starting with a personalized cover slide (name, logo, or short note) and following up with a clear UVP and tailored outcome that reflects their goals or pain points.

If you don’t earn their interest early, the rest of your proposal won’t get read.

Storydoc proposal statistics

5. Personalization is the strongest predictor of proposal success

When we looked at what makes the biggest difference in how buyers interact with proposals, one factor stood above all others: personalization.

Even light customization had a meaningful impact.


Here’s how different levels of personalization affected reader engagement:

  • Company name and logo only → +12%

  • Name, logo, first name, and a short personal note → +29%

  • Tailored slides specific to the buyer’s needs → +33%

  • Combine all (personal message + bespoke slides) → +47%

Benefits of different types of personalized proposals:

And one bespoke slide stood out as a top performer:

Proposals that included a “What we’ve heard from you” slide saw a 31% increase in engagement.

Still, only 11% of the proposals we analyzed included it. That’s a huge missed opportunity.

Storydoc proposal statistics

6. Even your opening message can make a big difference

Before anyone reads your proposal, they notice how it starts. And a short, personalized message is one of the easiest ways to make it feel human.


Here’s how different types of personal notes affected engagement:

  • No note at all – 0% baseline

  • Just text – +13%

  • Message with your photo – +24%

  • Message with your photo + their logo or photo – +29%


This is one of the simplest upgrades you can make - and it signals effort, attention, and intent right from the start.

Benefits of adding a personal note to your proposal:

Storydoc proposal statistics

7. The more people read your proposal, the better your chances of closing

One person opening your proposal doesn’t mean you’re close to winning the deal. In fact, it’s often a bad sign.

Across all proposals we analyzed, the average number of internal readers was 3.7 - and this internal traction turned out to be one of the strongest predictors of success.


Here’s what we found:

  • 1 internal viewer usually means the proposal never made it past your initial contact. It’s a dead end.

  • 2 viewers can signal interest, but it’s still risky. It’s not yet being shared with decision-makers.

  • 3 or 4 viewers means you’re gaining internal momentum. The deal is alive and moving.

  • 5 or more viewers is where close rates jump significantly. That’s the zone where consensus starts forming.

Average number of internal readers per proposal:

3.7

(but you should aim for 5 or more!)

This matches a broader trend: B2B buying cycles are longer, and the average deal now involves 6 to 10 stakeholders. More people weighing in means slower decisions - but it also means more chances for your proposal to build buy-in, if it reaches the right hands.

Storydoc proposal statistics

8. The sweet spot for proposals is around 10 slides

When it comes to proposals, length does affect engagement - but not as drastically as it does in the earlier stages of the buyer journey.

The average proposal has a 38% completion rate. When the proposal is kept under 10 slides, that number increases to 43%. However, once you cross the 18-slide mark, engagement starts to drop off sharply.

How many people will finish reading your proposal?

This makes sense. Too short, and your proposal may feel incomplete or rushed. Too long, and it becomes a chore to finish. The sweet spot sits between 10 and 18 slides - long enough to make your case, but tight enough to keep attention.

And remember - you’re at the bottom of the funnel. By the time someone’s reading your proposal, they’ve already seen your product pages, sales materials, and brand story.

There’s no need to rehash it all again. Focus on the details that matter at this stage: the solution, the pricing, and what happens next.

Storydoc proposal statistics

9. The top-performing proposals tend to include the same key slides

No two proposals are exactly the same - but the most effective ones do tend to follow a pattern. Or a recipe for proposal success if you’d like.

When we looked at the structure of top-performing proposals, the same slides kept showing up again and again.


Here are the slides top-performing proposals included most often:

  • Client logos – 97%

  • About us – 93%

  • Service or product overview – 87%

  • Case studies or testimonials – 81%

  • Pricing breakdown – 73%

  • Implementation / project timeline – 63%

  • Next steps – just 57%

  • ROI slide – only 17%

  • “What we’ve heard from you” slide – just 11%

Which slides show up in top-performing proposals?

Some of these are expected - logos and product overviews are standard. But the lower stats are the ones worth paying attention to.

Only 57% of proposals included a clear “Next steps” slide, even though that’s one of the easiest ways to move the deal forward.

And only 17% included ROI content, which is critical when buyers are comparing multiple options or need to justify the investment to others internally.

You can explore all these slides in our interactive slides gallery.

Just scroll through, pick the ones you need, and choose from a range of ready-made layouts - or type in a quick prompt to see how the slide could look for your specific use case, right there on the page.

Storydoc proposal statistics

10. The best slide you’re not using - ‘What we’ve heard from you’ slide

One of the most surprising things we found was that the best-performing slide across all the data was also one of the most overlooked.

Only 11% of proposals included a “What we’ve heard from you” slide - but the ones that did saw a 31% increase in engagement.

Just one tailored slide, summarizing the buyer’s goals and concerns in their own words, makes your proposal feel like it was built for them, not for anyone.

It’s the slide that proves you’ve truly listened - that you understand their challenges, their priorities, and what really matters to them.

Benefit of adding a "What we've heard from you" slide:

+31%

Higher engagement on your proposal

Most reps skip this slide - not because it’s difficult, but because it takes a bit more effort than just reusing the standard deck. And that’s exactly what makes it such a high-impact opportunity.

It requires some thought and a little time, but the return is worth it. Because so few people put in that extra work, it’s one of the easiest ways to stand out.

Storydoc proposal statistics

11. Buyers click the ‘pricing’ slide more than anything else

You might have spent hours working on your messaging and writing a compelling intro. Turns out, most buyers just want to know what it’s going to cost.

In our data, 87% of engaged proposal sessions included a click on the pricing slide - far more than any other section.


Other highly viewed slides in proposals were:

  • Implementation timeline – 61%

  • Terms & conditions – 54%

  • Team – 46%

Which slides do people click on in your proposal?

Storydoc proposal statistics

This tells us something simple but important: buyers are scanning for specifics. They’re trying to figure out if the offer fits their budget, timeline, and internal approval process.

It’s not that the other slides don’t matter - they help reinforce credibility and build confidence. But if you hide the pricing or delay the details until slide 14, you’re risking bounce before buy-in.

If a buyer wants to say yes, you need to make it easy for them. Start by giving them the information they’re already looking for.

Storydoc proposal statistics

12. Don’t leave your buyer wondering what happens next

By the time someone’s reading your proposal, they’re past the discovery stage. They don’t need to “book a call to learn more” - they need a clear path to action.

That’s why proposal-stage calendars don’t have the same impact as they do earlier in the funnel.


According to our data:

  • Calendar embeds in proposals led to an 11% lift in meetings booked

  • Compare that to +27% in brochures and one-pagers

  • And +22% in pitch decks or +23% in customer success decks or general collateral

Impact of embedding a calendar in your deck:

It makes sense. At the top of the funnel, a calendar is an invitation to start a conversation. But in a proposal, the buyer is already engaged. What they want is clarity.

That doesn’t mean you should skip the call to action altogether.

In fact, across all doc types, proposals with a clear next step (like “review and sign” or “confirm the timeline”) saw 27% higher conversion than those that ended with a vague close or generic “thank you.”

If you're asking them to review the terms or sign off, say so. If you're available for a final call, make it obvious. Whatever the right action is at this stage, make it as easy for the buyer to take as you can.

Storydoc proposal statistics

13. Almost half of all deals are signed within 48 hours of reading the proposal

When it comes to proposal approvals, time is not on your side. If the buyer is serious, they’ll act quickly. And if they don’t… you’re losing the deal.


Here’s how the approval window breaks down:

  • Within 1 hour of reading your proposal: 3%

  • Within 12 hours: 8%

  • Within 24 hours: 16%

  • Within 48 hours: 19%

  • Between 3–7 days: 35%

  • Between 8–14 days: 13%

  • 3+ weeks later: Only 6% make it through


That’s 46% of accepted proposals signed within the first two days, 81% within a week, and 94% within two weeks.

How likely are buyers to sign your proposal over time?

This means that if your proposal hasn’t been accepted within a few days, you’re already losing momentum. And by the third week, the deal is almost certainly dead.

Don’t sit back and wait. Follow up within 24–48 hours, check for blockers, and keep the conversation alive. If you’re not guiding prospects through the buying process, it’s stalling.

Storydoc proposal statistics

And that’s it from us for now!

Want to share our findings? Go for it! All images, animations, and items of data featured in this study are available for reuse. Please, make sure to reference the source and link back to this page to give the authors proper credit.

If you’d like to put these insights into practice, we’ve created a gallery of professionally designed proposal templates, built to reflect the findings from this research.

Every slide, structure, and layout was carefully designed to match how real decision-makers review and evaluate proposals today.


You can check out the full gallery here:

No templates found

If you’re looking for more guidance, we’ve also curated some of our most in-depth resources on proposal writing, design, and strategy - so you can win more deals:


And, of course, stay tuned for more fresh data coming up. Strong proposals should be built on insight, not guesswork.

Methodology and limitations

This study is based on the behavior of readers across more than 1.3 million proposal reading sessions created and shared using Storydoc.

We only included live proposals - those that were actually sent to prospects - so all insights reflect how real stakeholders and decision-makers interacted with real business materials.

Unless explicitly noted, all comparisons in this analysis are based on proposals that included a given element versus those that did not. For example, proposals that featured a personal calendar on the final slide were compared directly to those without one.

To ensure accuracy in reading time data, we excluded upper outliers - sessions that lasted unusually long (such as those left open for several hours) - to prevent skewed averages.

The proposals in this study came from a wide range of industries and company sizes. Given the scale of the sample, the findings are broadly representative of how proposals perform across different sectors and use cases.

Itai Amoza

Hi, I'm Itai, one of Storydoc's co-founders. As a data geek, I couldn't hold myself from jumping into our data and discovering what makes top-performing sales decks so successful. I'm excited by the opportunity to share our findings and contribute to the sales and marketing community!

Engaging decks. Made easy

Create your best proposal to date.

Stop losing opportunities to ineffective presentations.
Your new amazing deck is one click away!