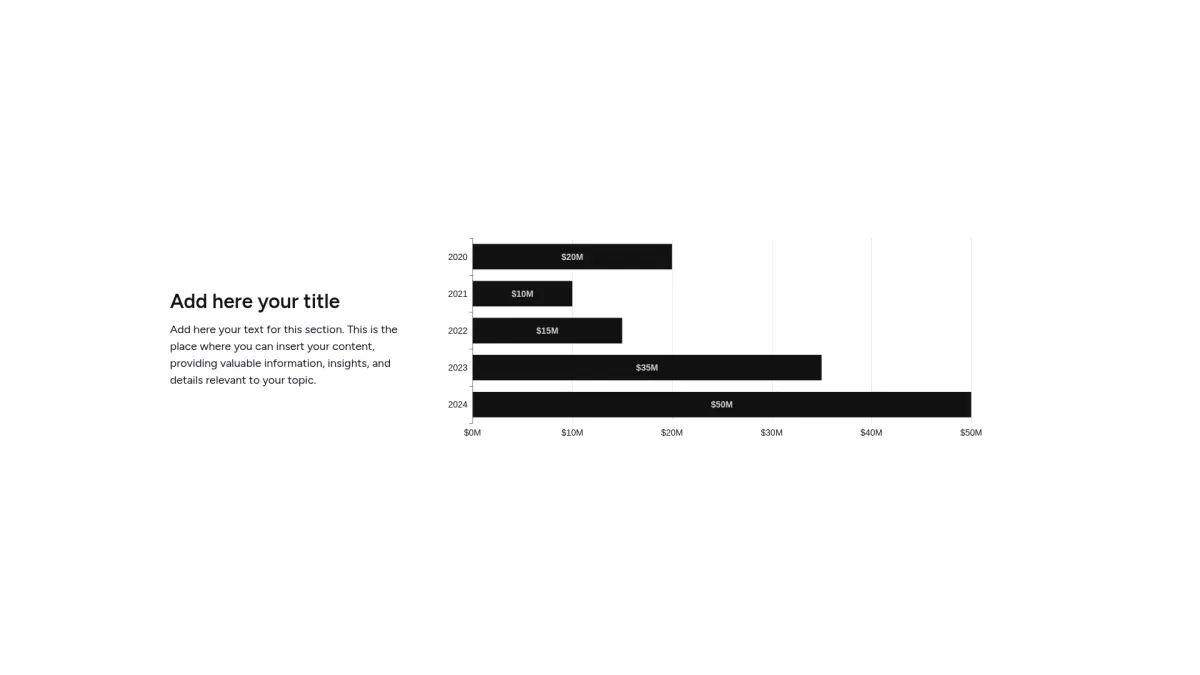
General chart slide template
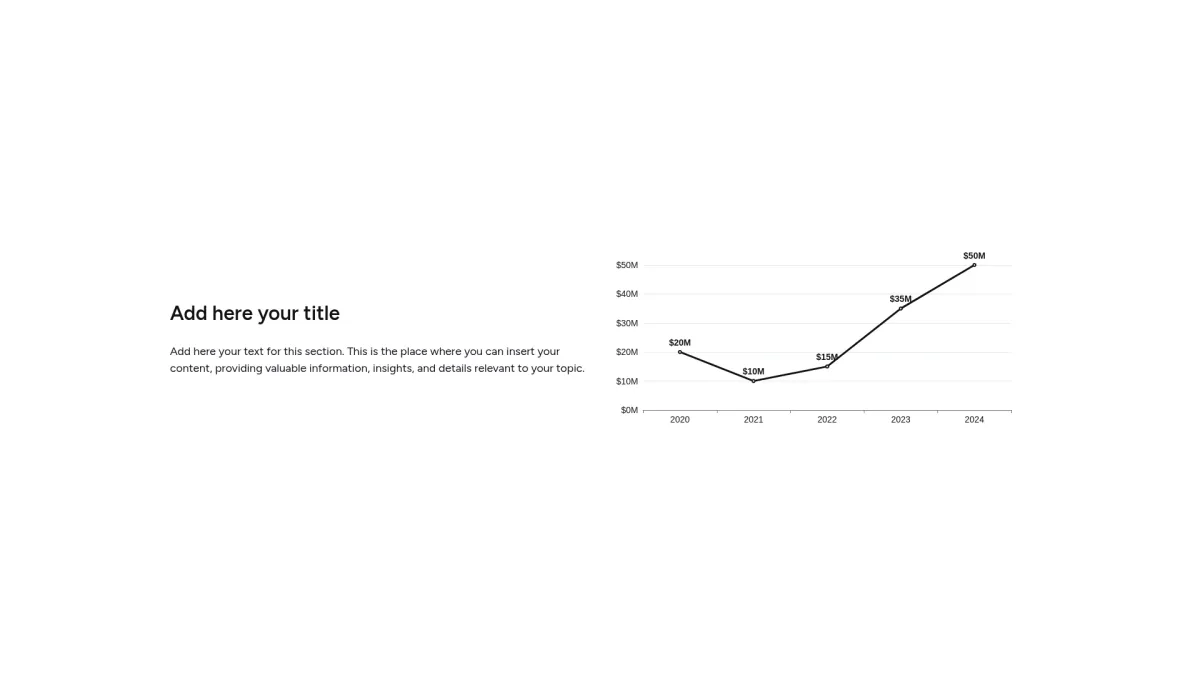
Choose the general chart slide layout you love most. Grab an interactive template that clarifies complex data and boosts strategic decision making.
Slide customization
Prompt
Color range
Font
This general chart slide template serves business leaders, marketing teams, and data analysts seeking clear, impactful presentations that drive strategic decisions and enhance communication across diverse organizational sectors with precision.
This template features title headers, data visualizations, and footers, offering automated AI-driven content generation and dynamic layout transitions. Its organized design facilitates concise messaging and improved audience engagement with impact.
Select your preferred general chart slide layout from the available options and start customizing by generating content with your prompt, then choosing branding colors and fonts for optimal visual appeal.
Start working on your general chart slide with our AI presentation maker
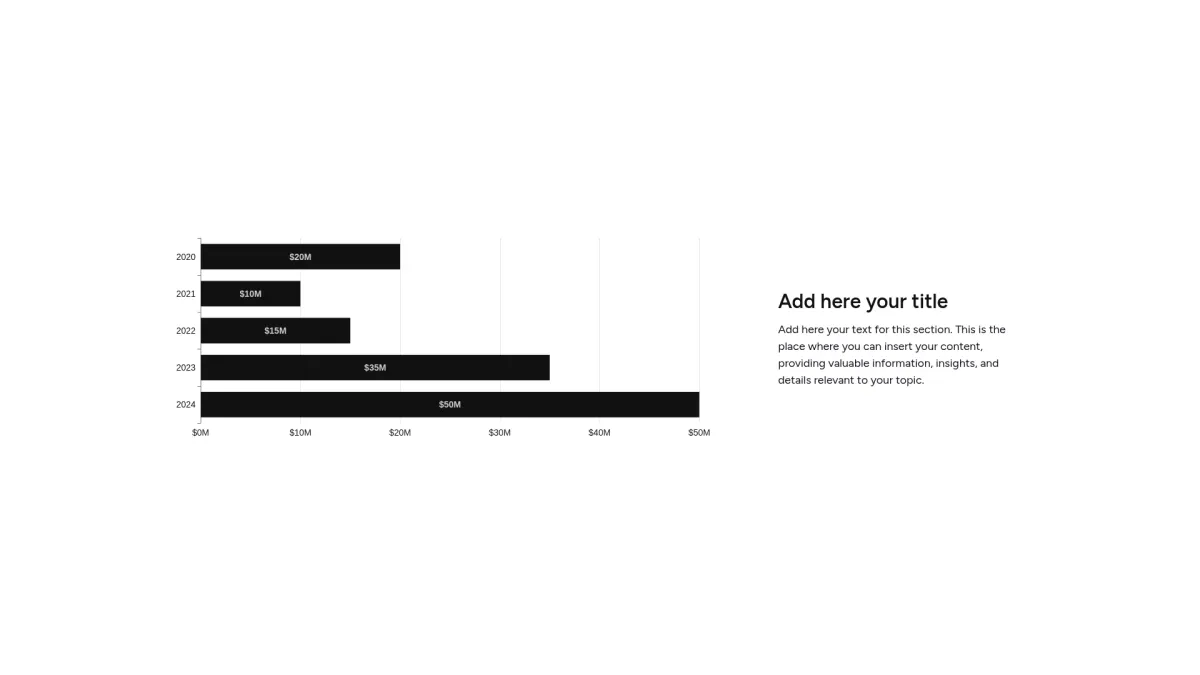
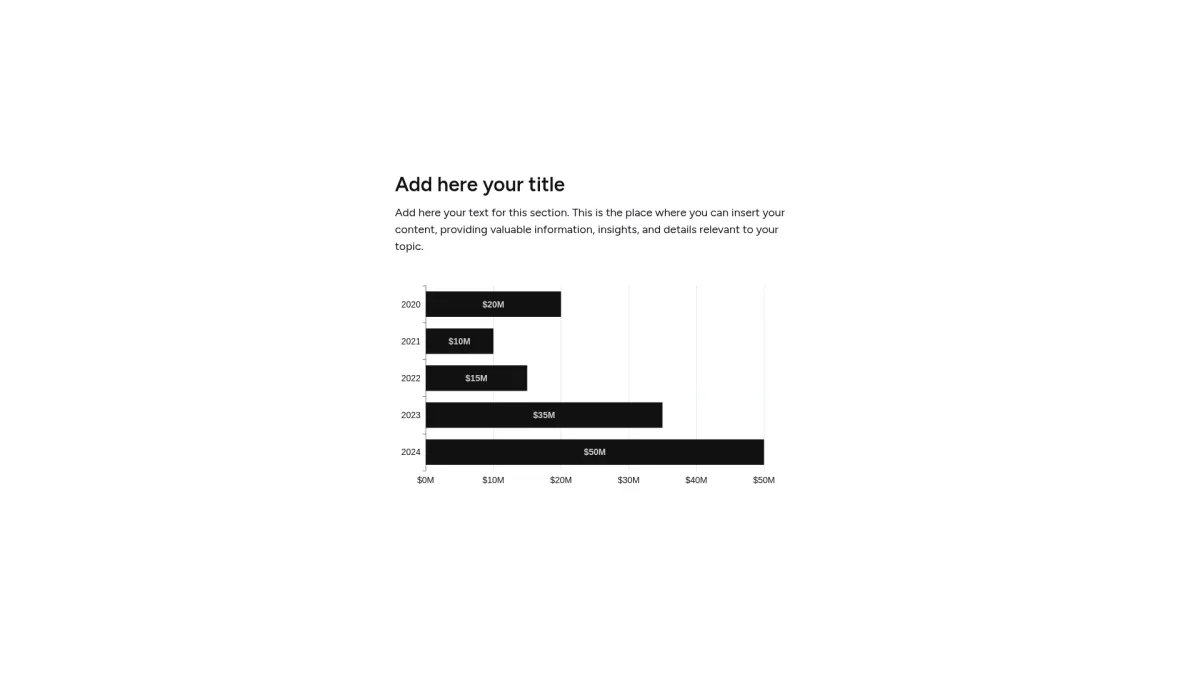
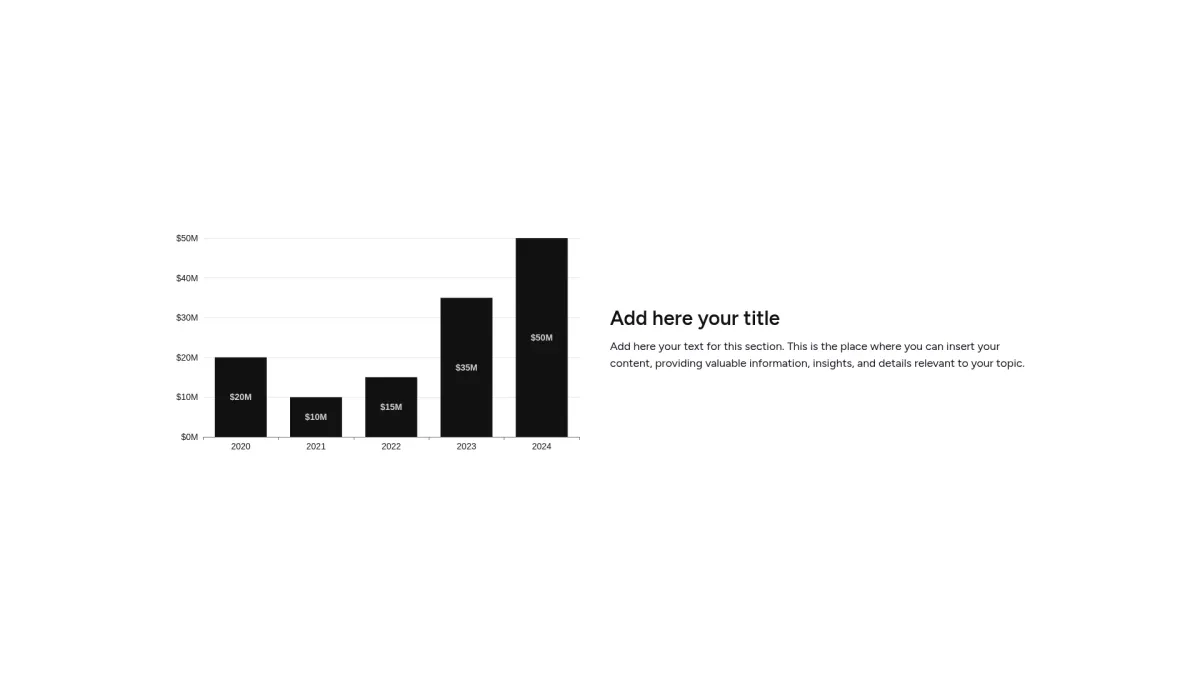
More layouts
Storydoc’s key features
Your template comes with an AI assistant that helps you write, rephrase, and ideate your content to perfection.
The AI design assistant helps you reimagine your slide design and try different slide layouts in a snap to fit your vision while keeping your content intact.
The data visualization design in Storydoc adapts automatically to your data inputs and your viewers can interact with your charts and graphs.
You can use dynamic variables in your Storydoc content (like in Email Marketing) to populate fields anywhere in your document and create personalized versions with a click.
Any Storydoc document you share will instantly generate engagement analytics you can view and track in Storydoc's out-of-the-box analytic dashboard.
You can embed anything in your Storydoc content. Embed your favorite marketing tools, videos, GIFs, dashboards, live feeds, calendar apps, e-signature, and more.
Storydoc can be integrated through API into your workflow so you can use your Storydoc content directly from your CRM, ERP, ALS, LMS, or whichever platform you work on daily.

Didn't find what you were looking for?
Explore thousands of effective expert-made slides for your business needs.

FAQ
Who should use this general chart slide template?
Who should use this general chart slide template?
Designed for business analysts, marketing managers, and financial strategists, this general chart slide template benefits product managers, team leads, and executive decision-makers who require clear data visualization and streamlined presentations. It helps busy professionals quickly articulate insights and support strategic communication, ensuring informed business outcomes.
What is the goal of a general chart slide?
What is the goal of a general chart slide?
The goal of a general chart slide is to present complex data in a clear, organized way with dynamic layouts. It aids in swift decision-making by transforming raw information into actionable insights for effective communication.
What does this general chart slide template include?
What does this general chart slide template include?
An effective general chart slide typically includes:
- Title header clearly displays slide purpose
- Data visualization section showcases key metrics
- Footer includes contact details and logos
This template ensures clarity, consistency, and professional presentation to support your data-driven business storytelling. It offers automated AI writing and dynamic design features for flexible customization.
How to tailor your slide with AI?
How to tailor your slide with AI?
After selecting your desired general chart slide, write a precise prompt for Storydoc’s AI to design and adjust content, colors, fonts, and layouts. The AI generates interactive, mobile-friendly slides using real data, and you can refine, download or edit the slide via drag-and-drop interfaces, ensuring seamless, efficient visual communication consistently.

Make a general chart slide that gets the job done
Stop losing opportunities to ineffective documents.
Try Storydoc now.