Charts and graphs templates
that data drives growth
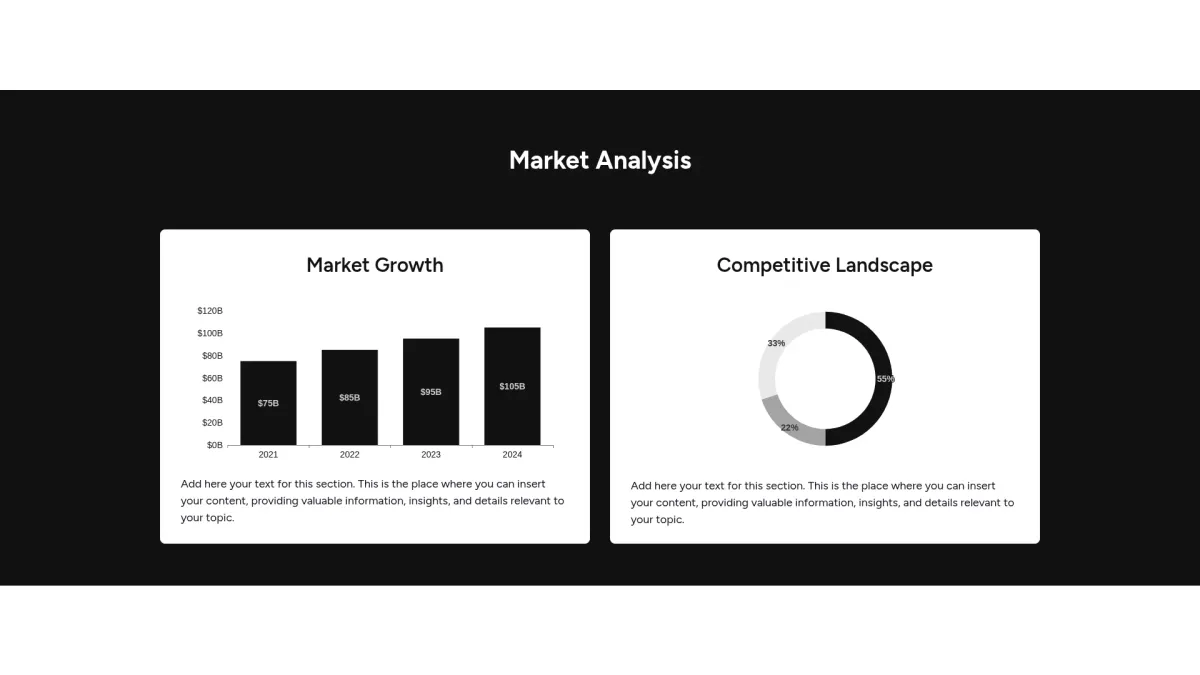
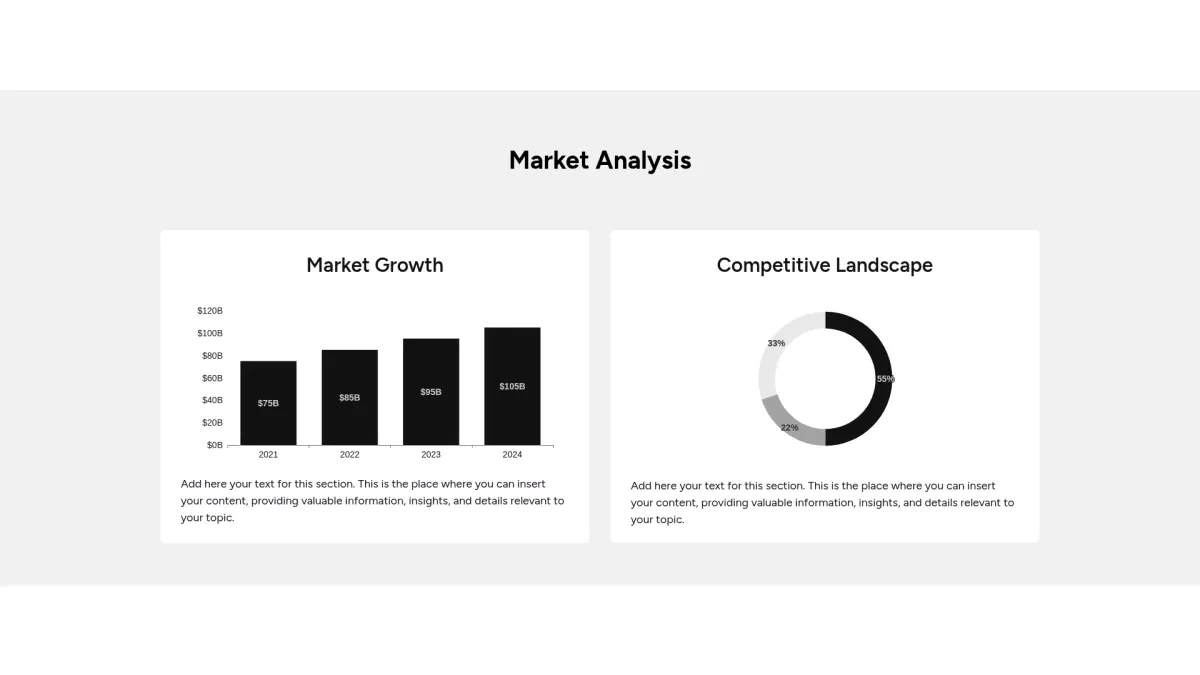
Choose the charts and graphs layout you love most. Grab an interactive charts and graphs template that empowers clarity and swift data insights
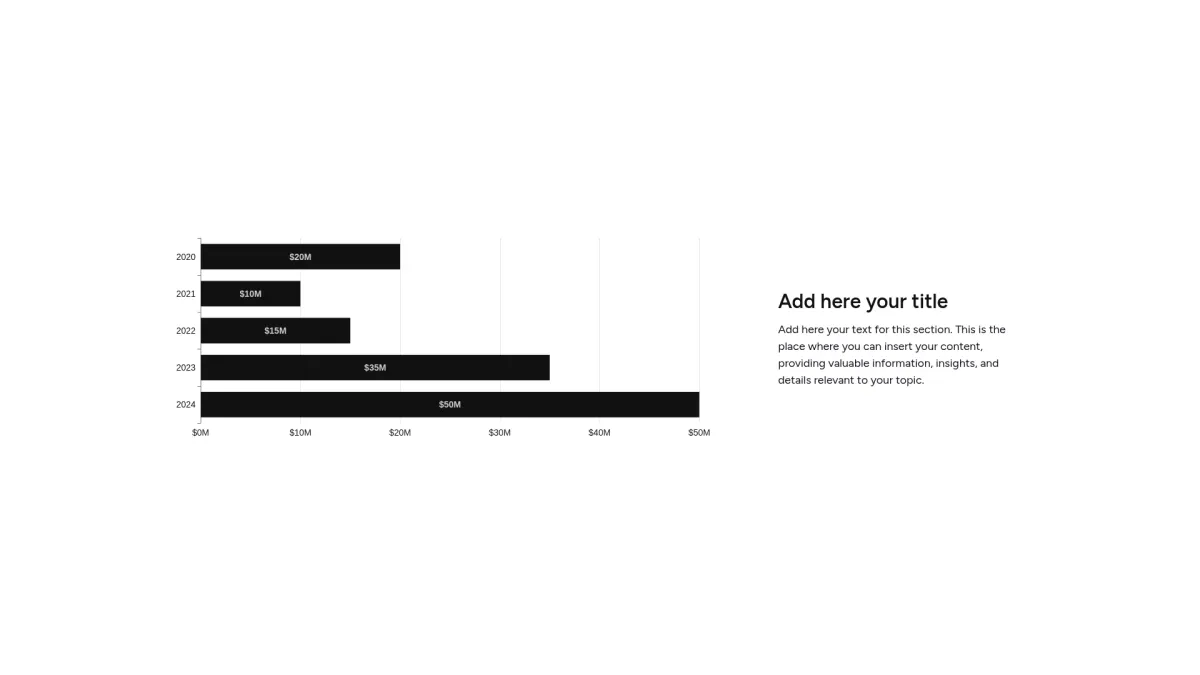
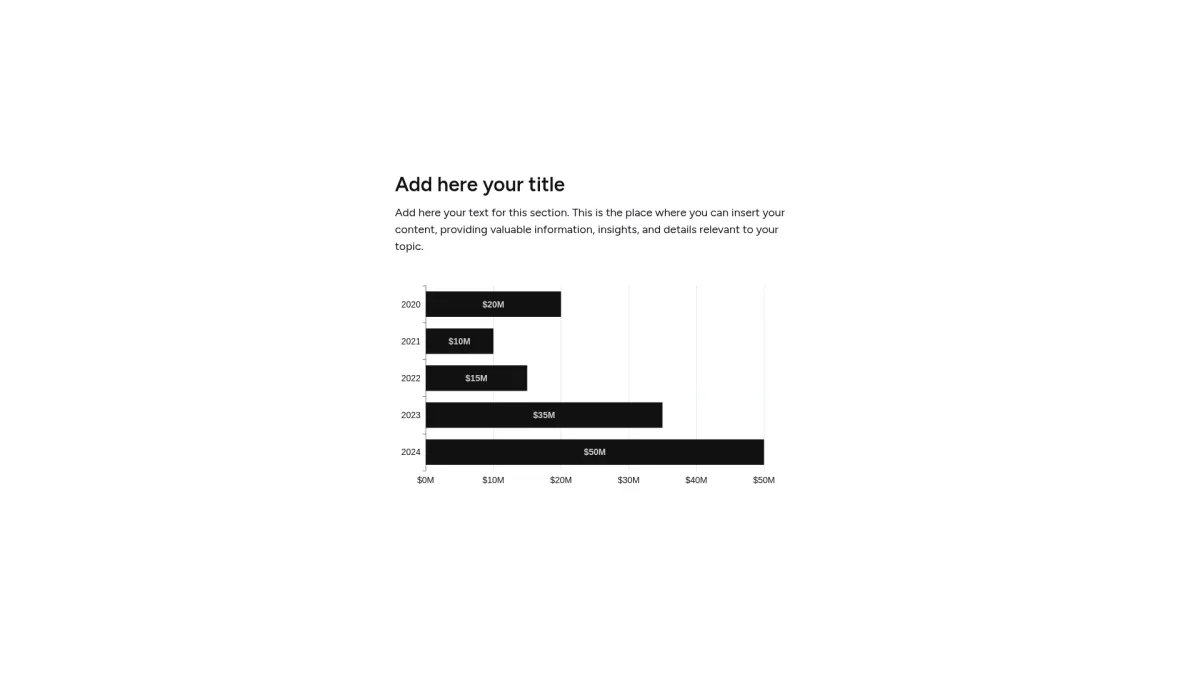
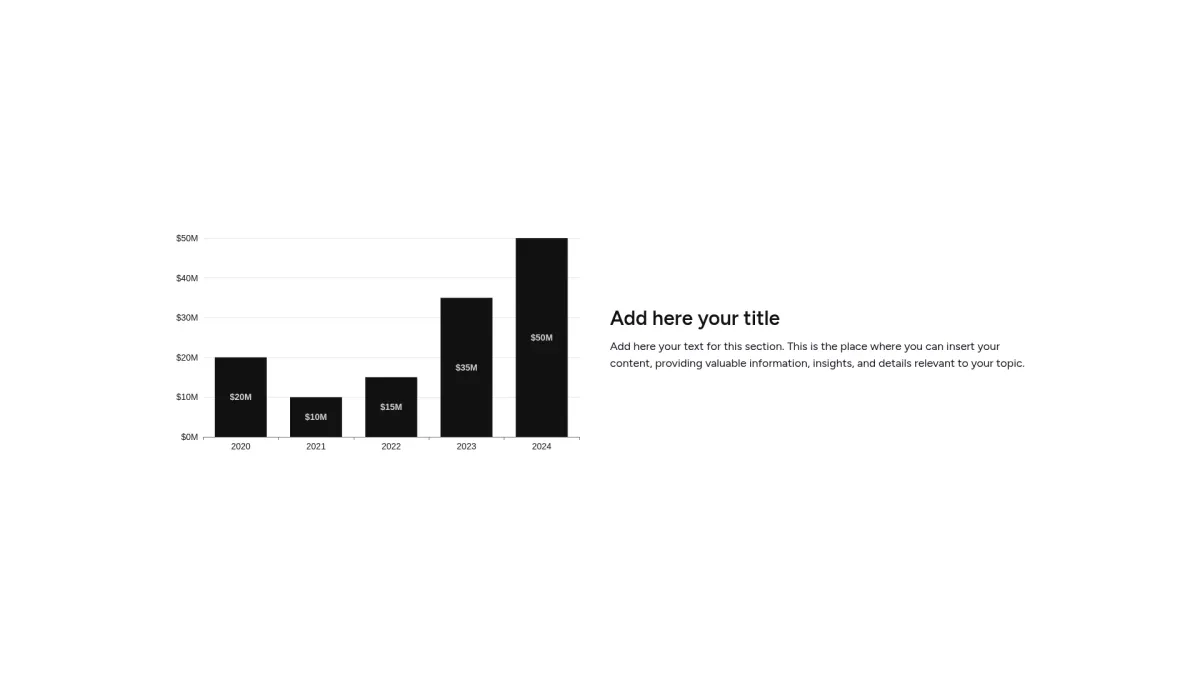
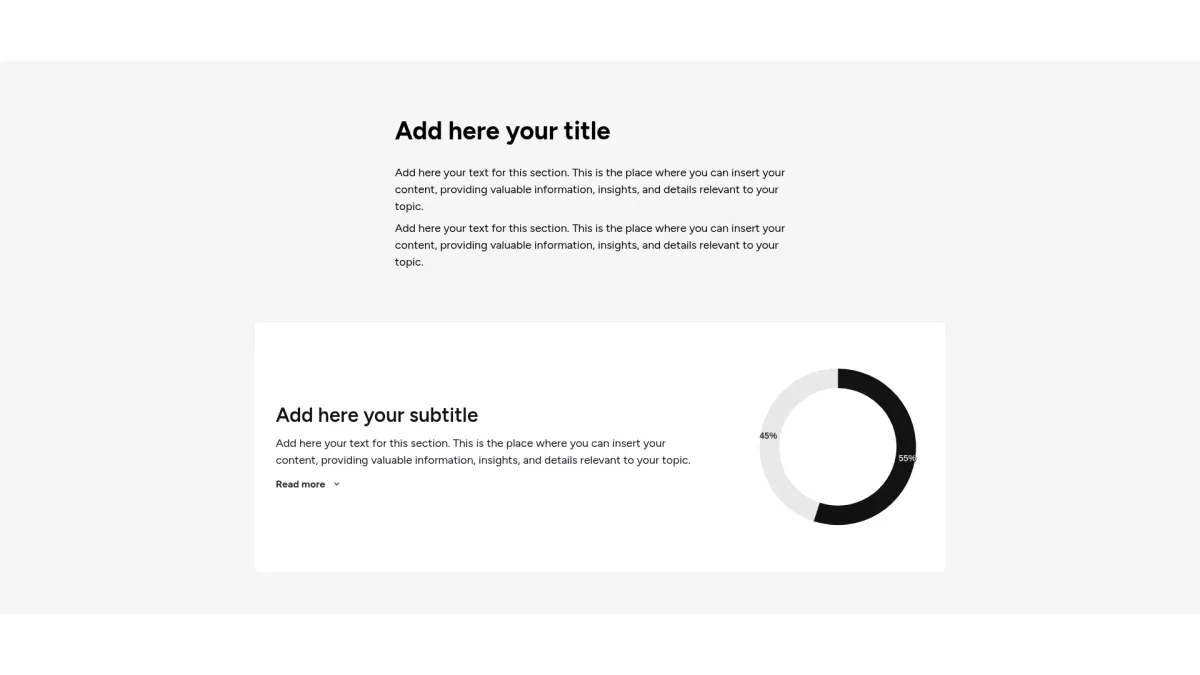
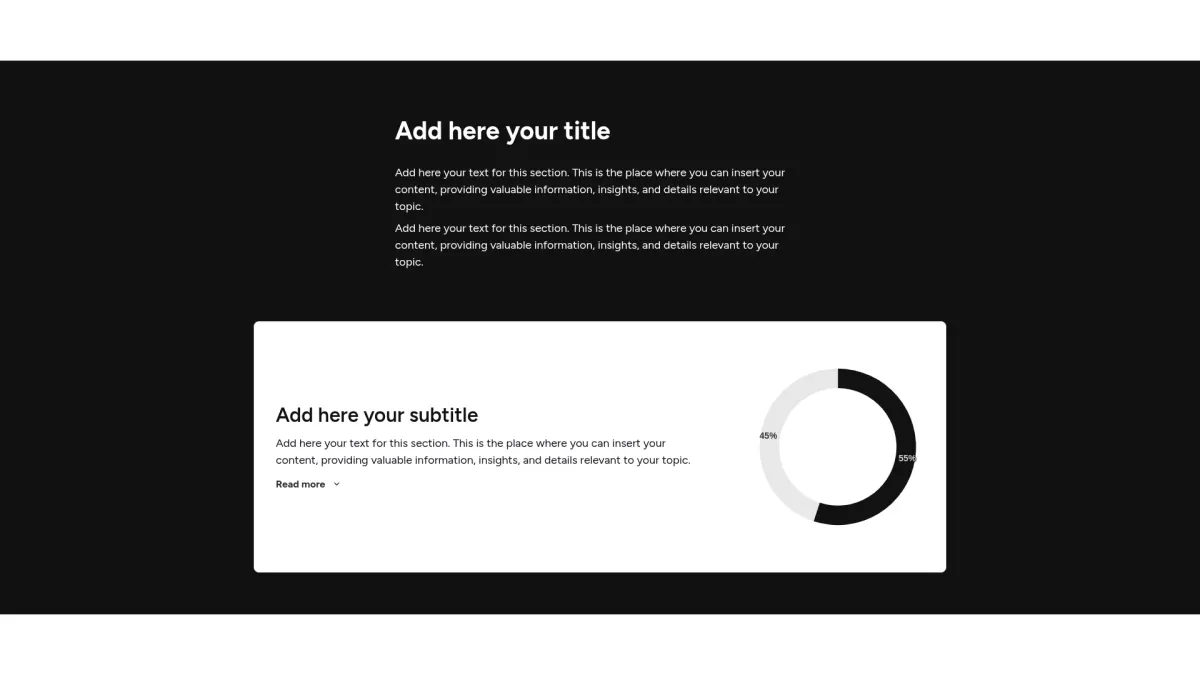
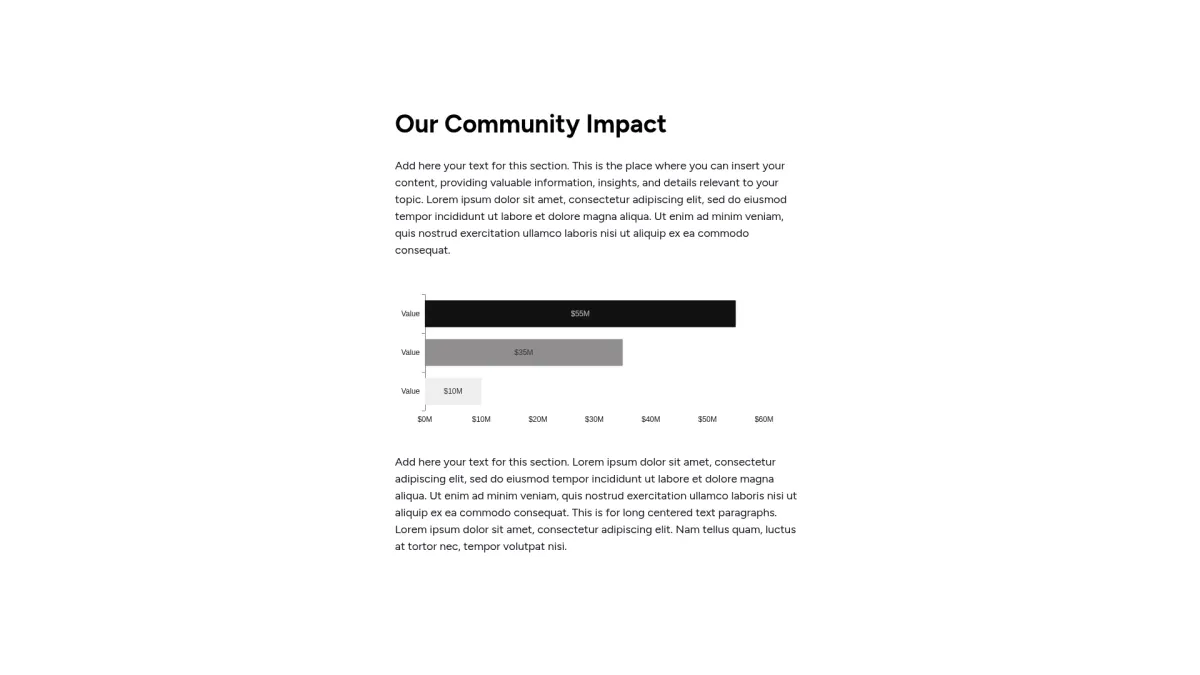
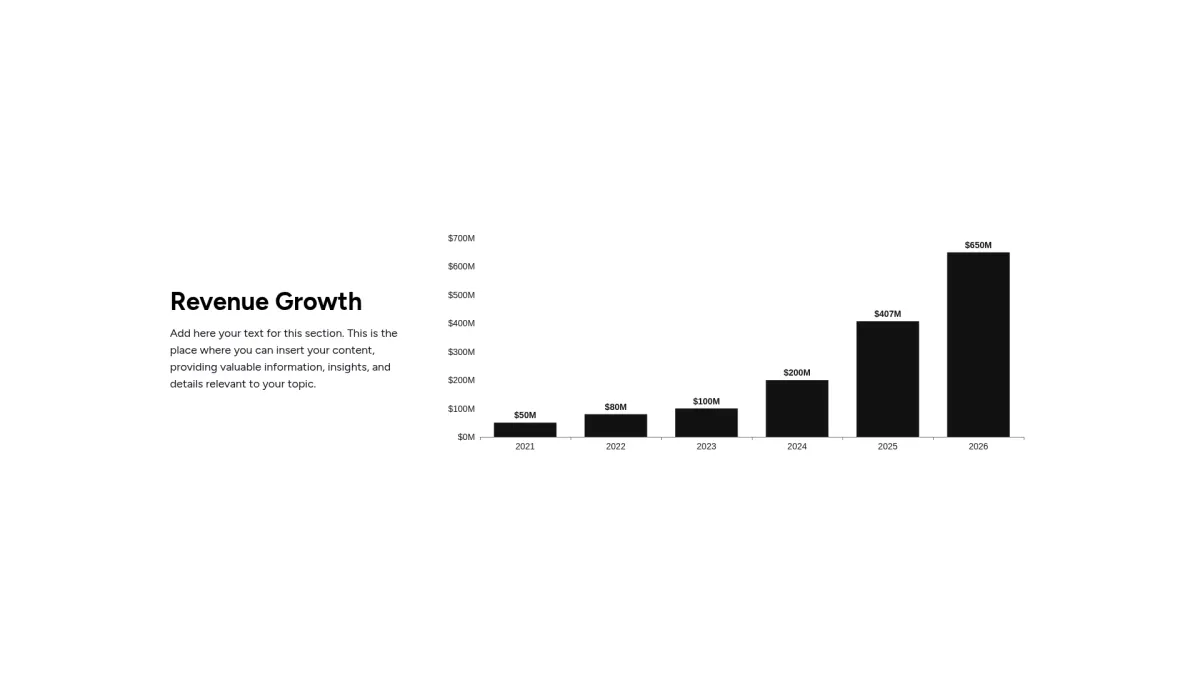
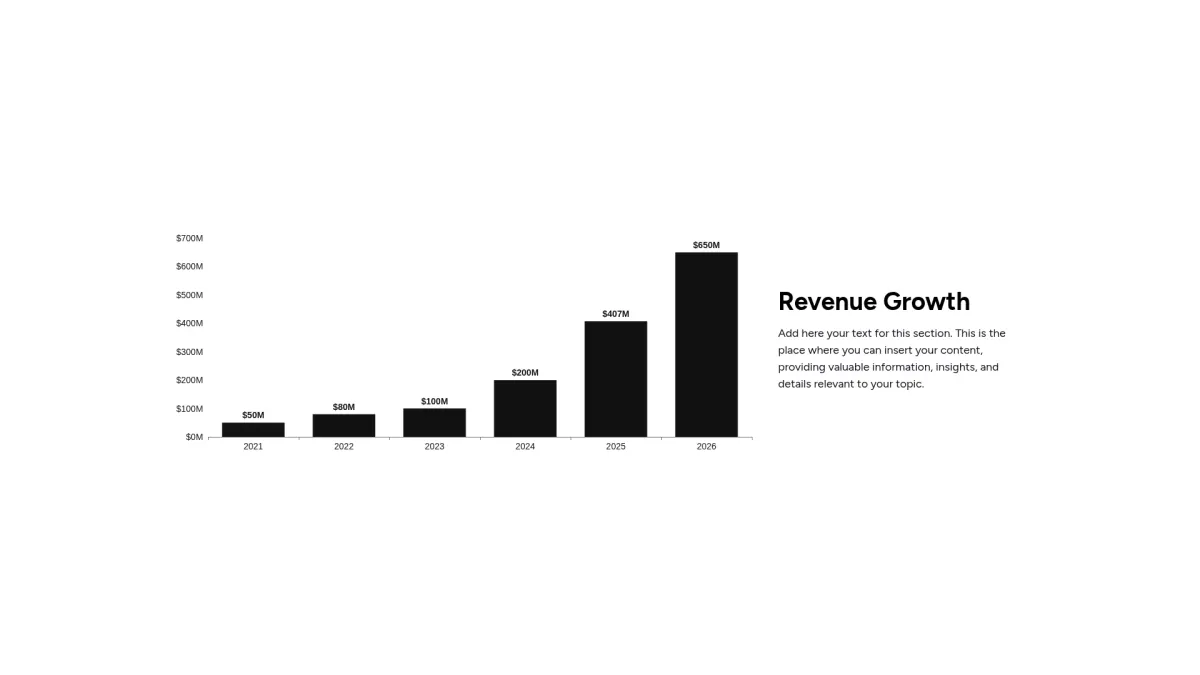
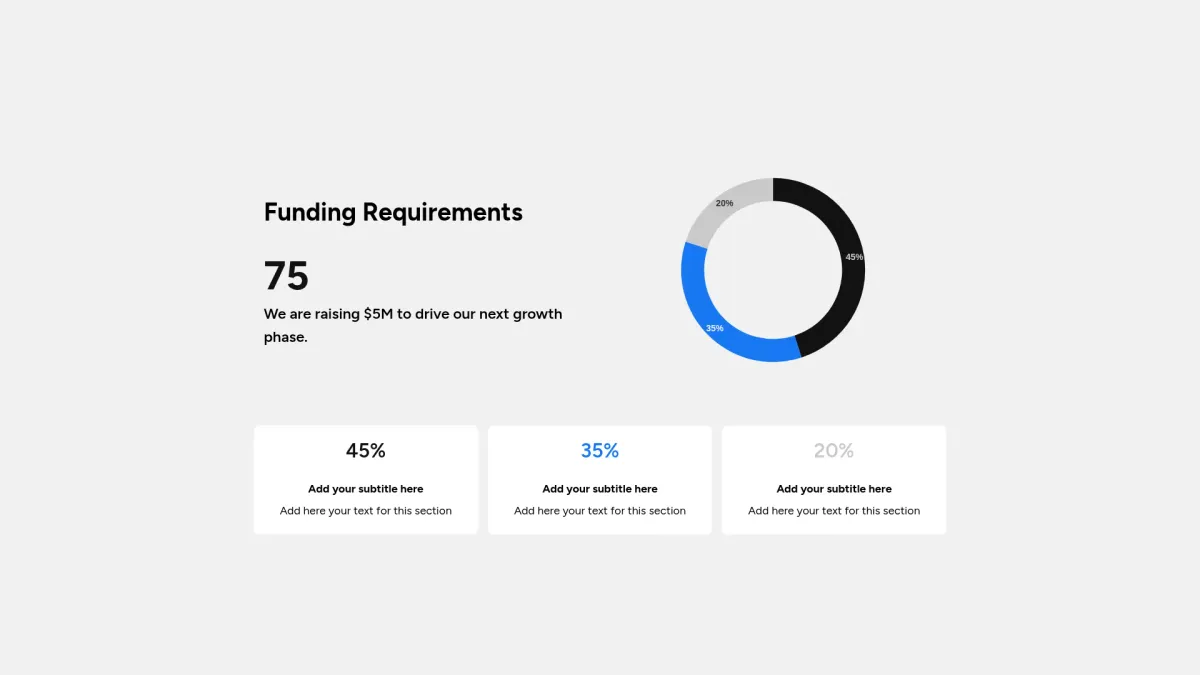
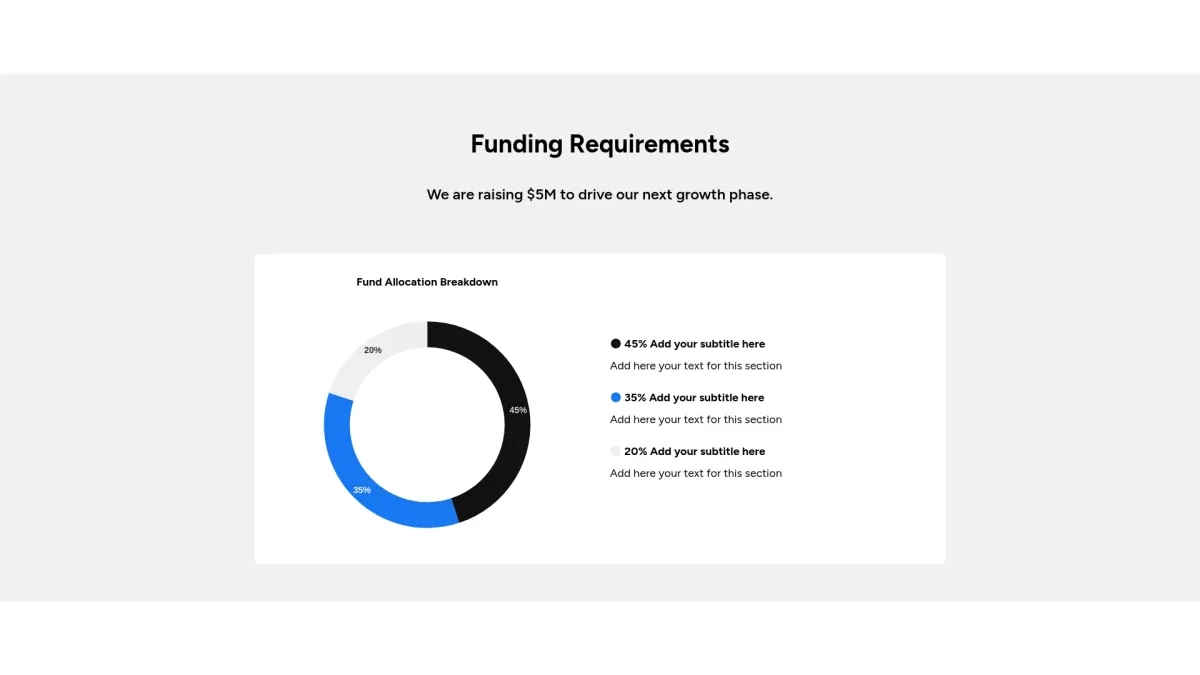
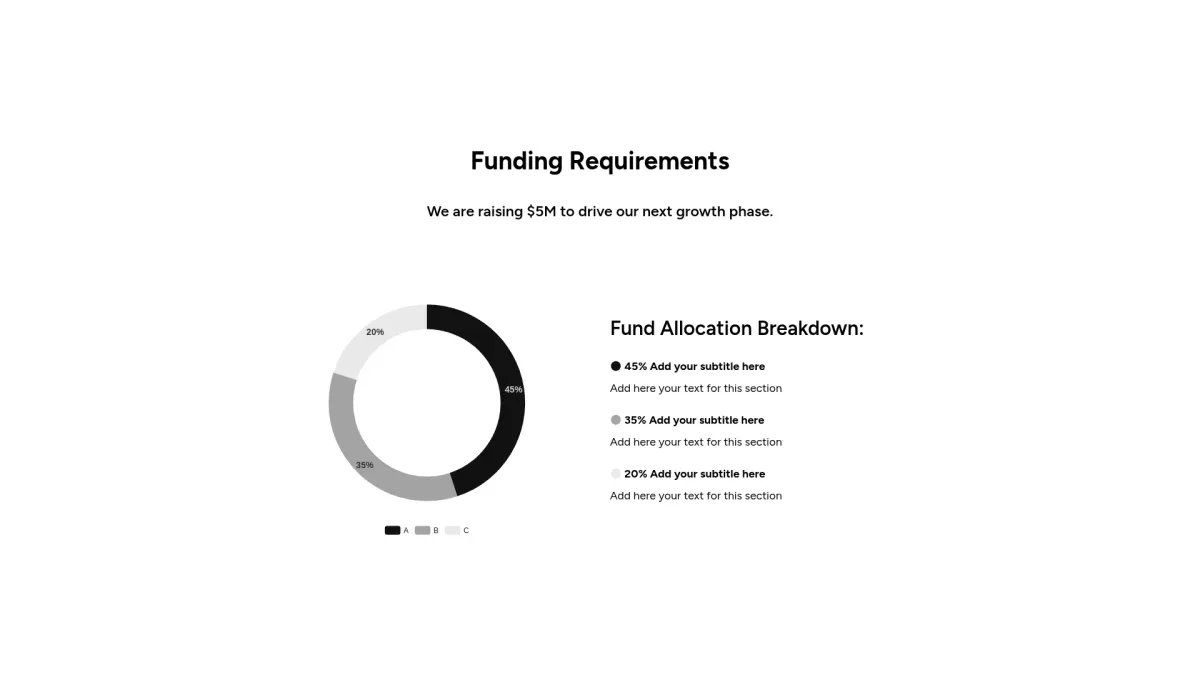
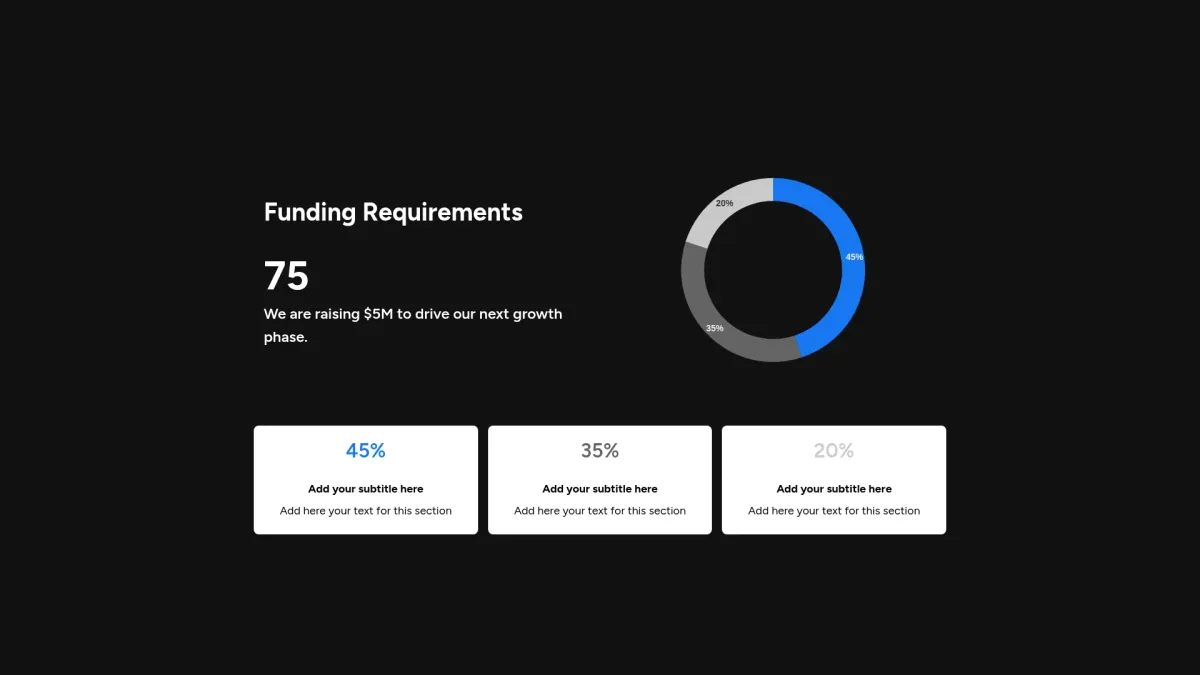
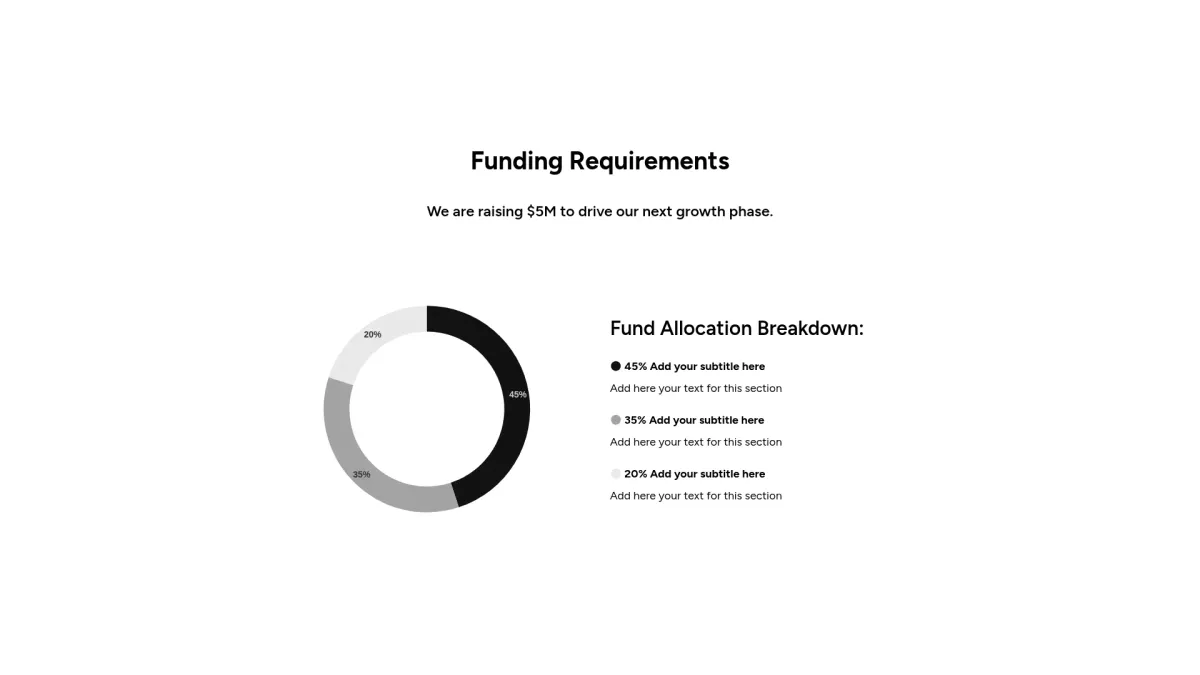
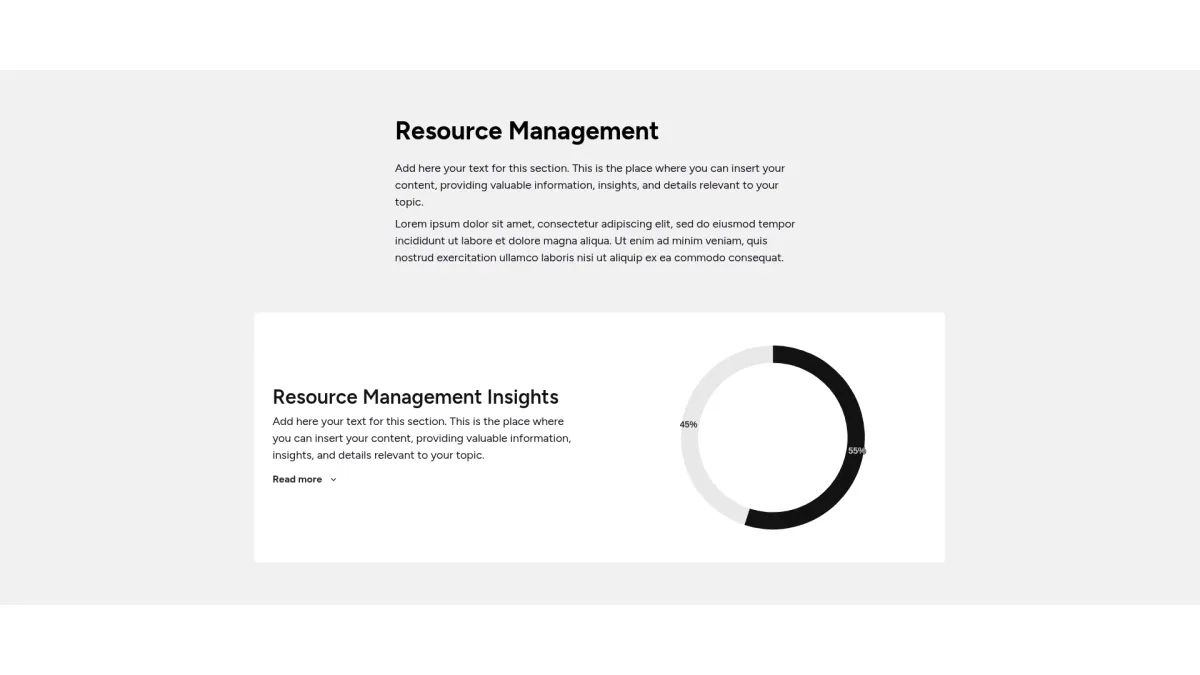
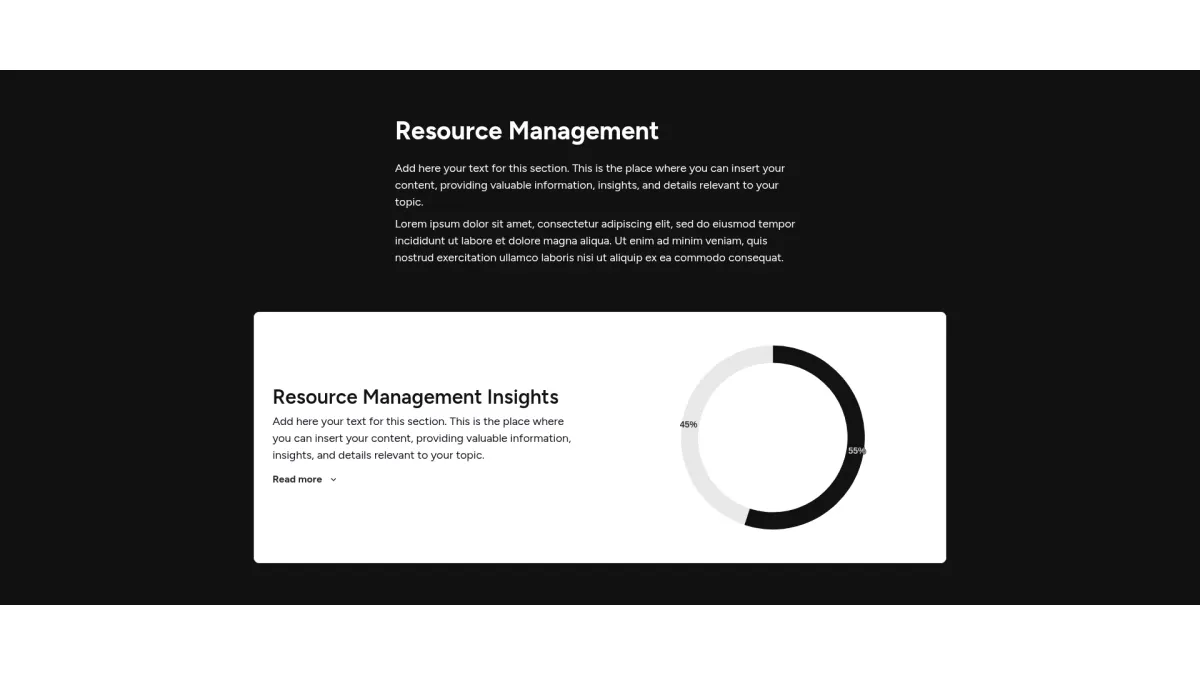
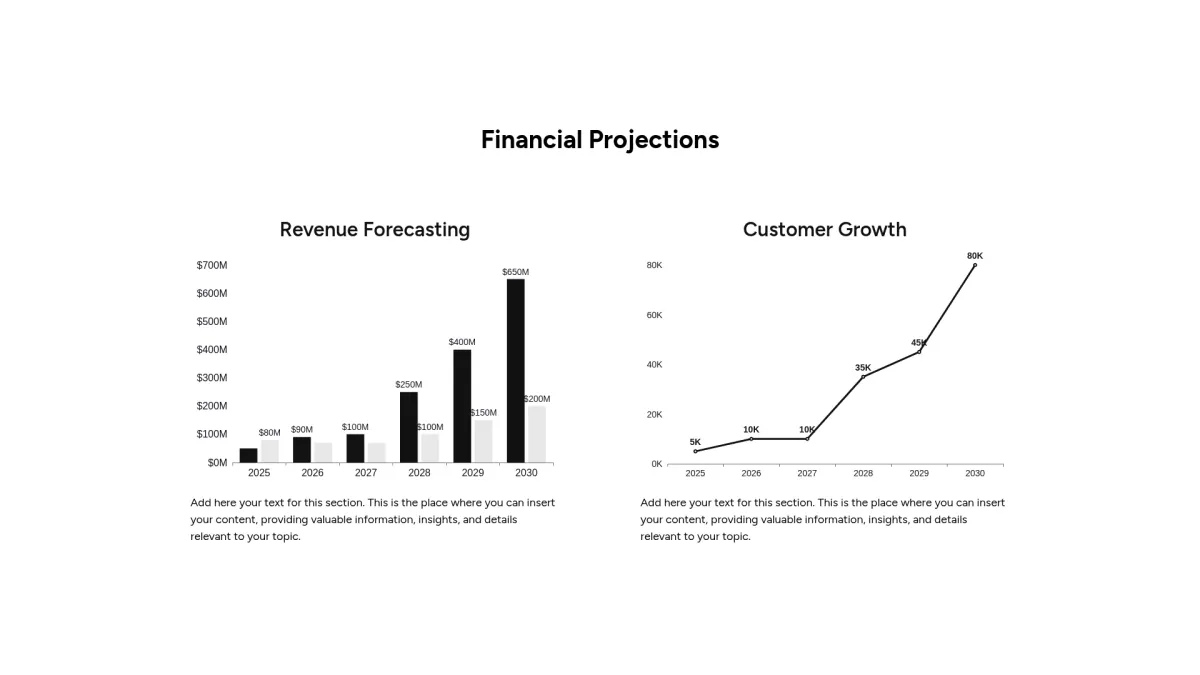
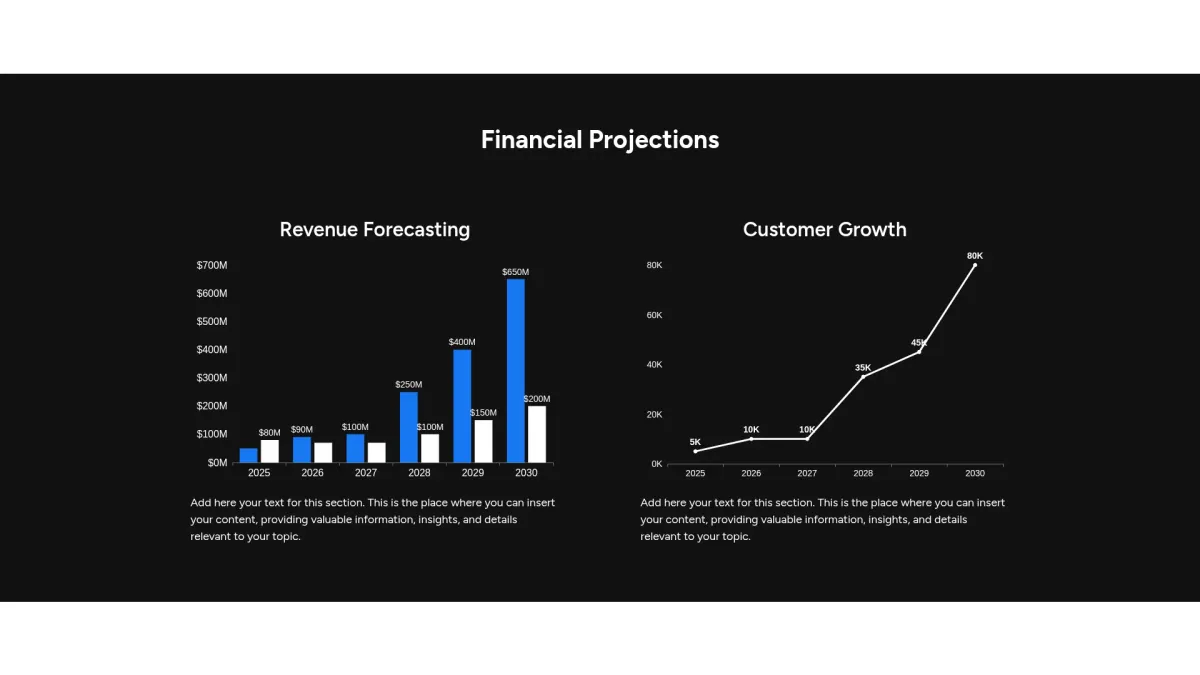
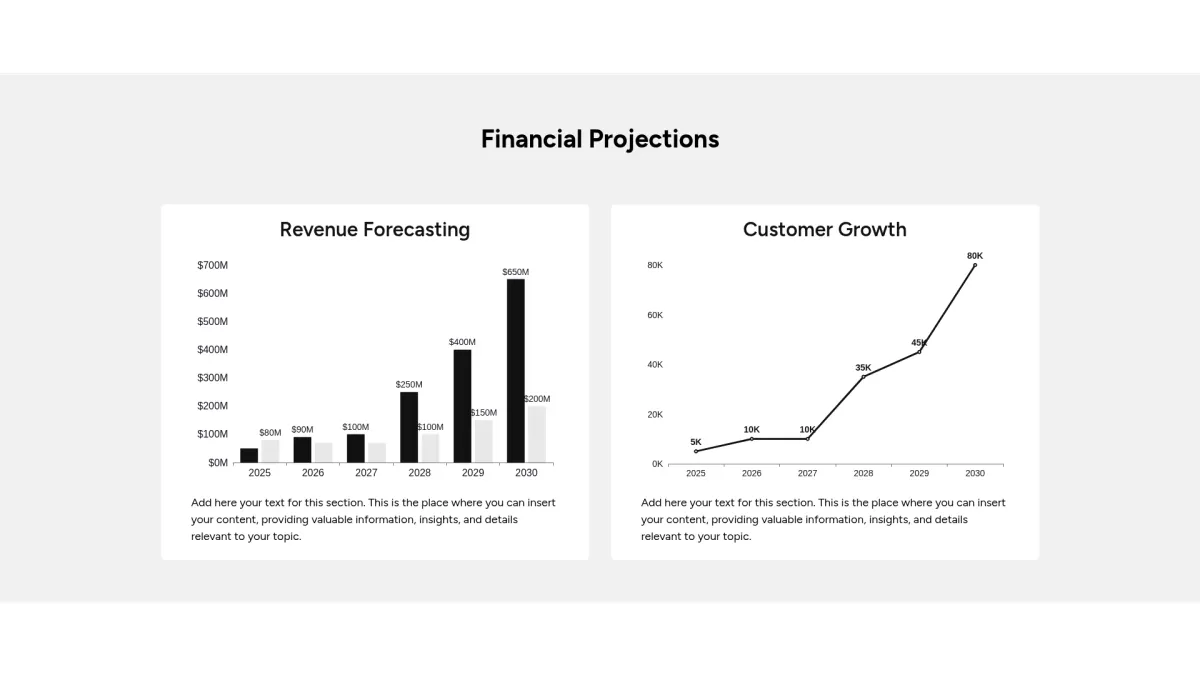
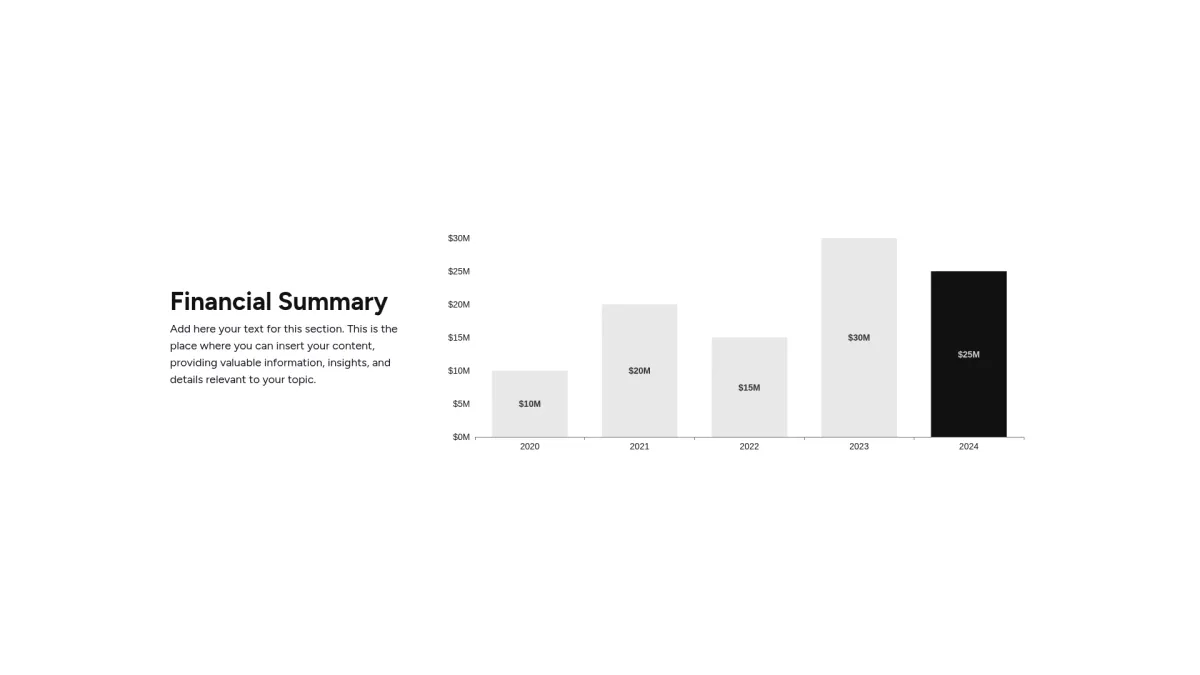
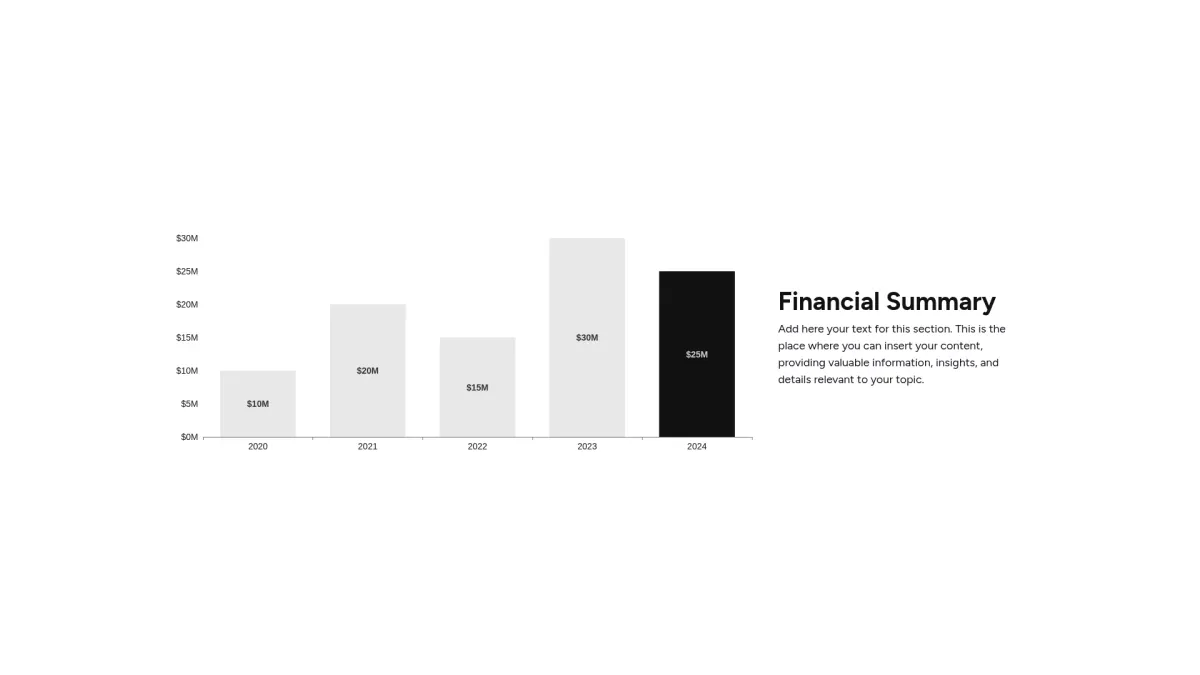
General chart slide
Choose the general chart slide layout you love most. Grab an interactive template that clarifies complex data and boosts strategic decision making.
Customize slide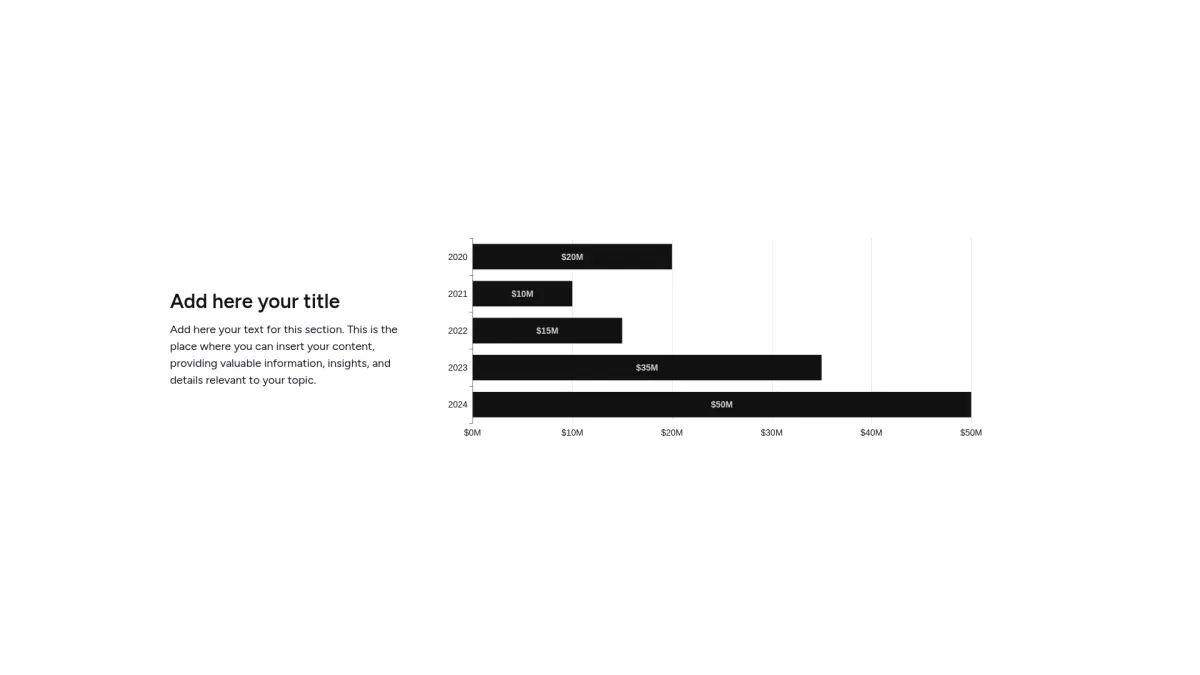
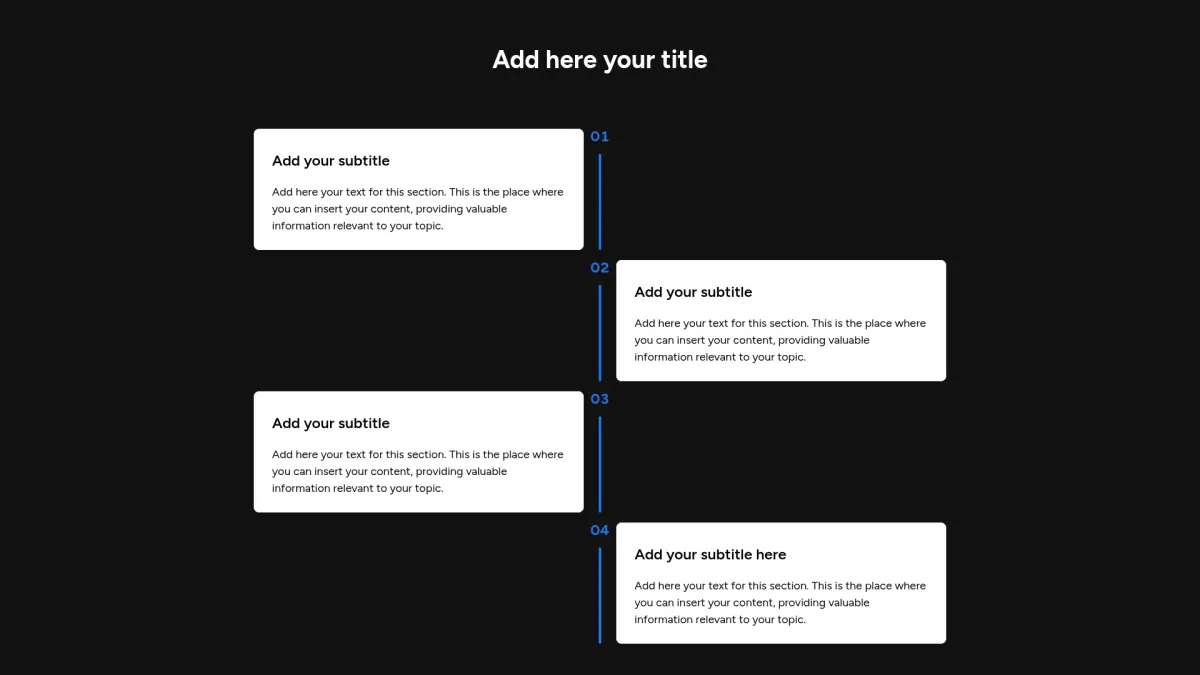
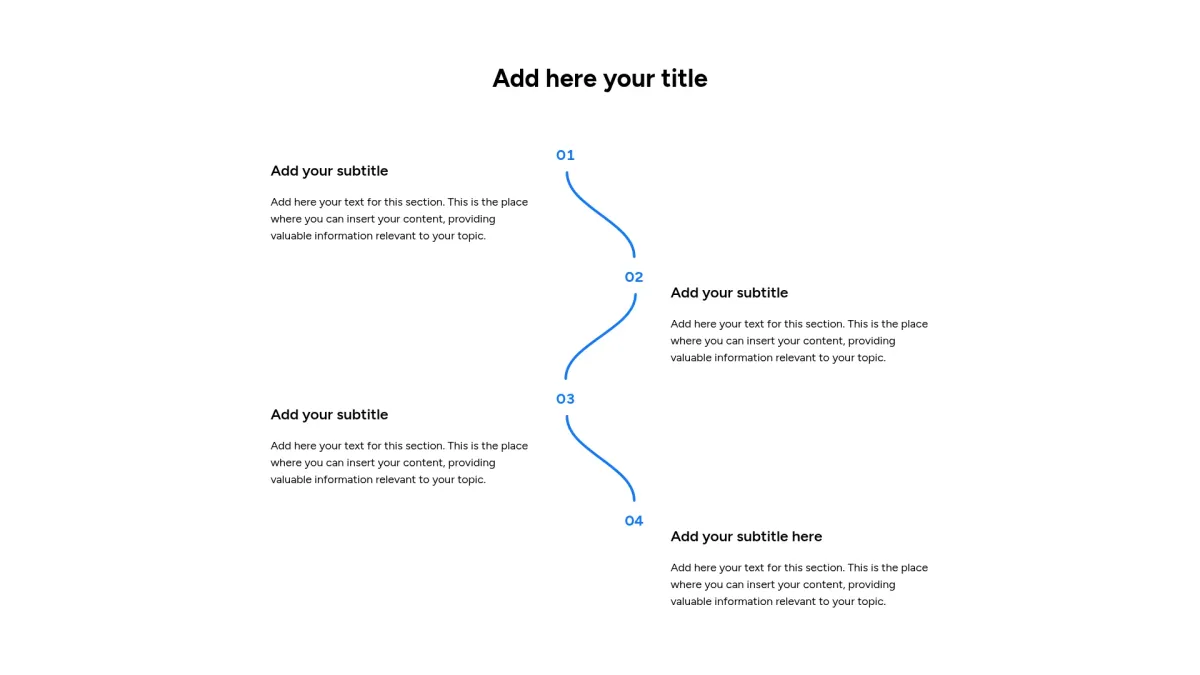
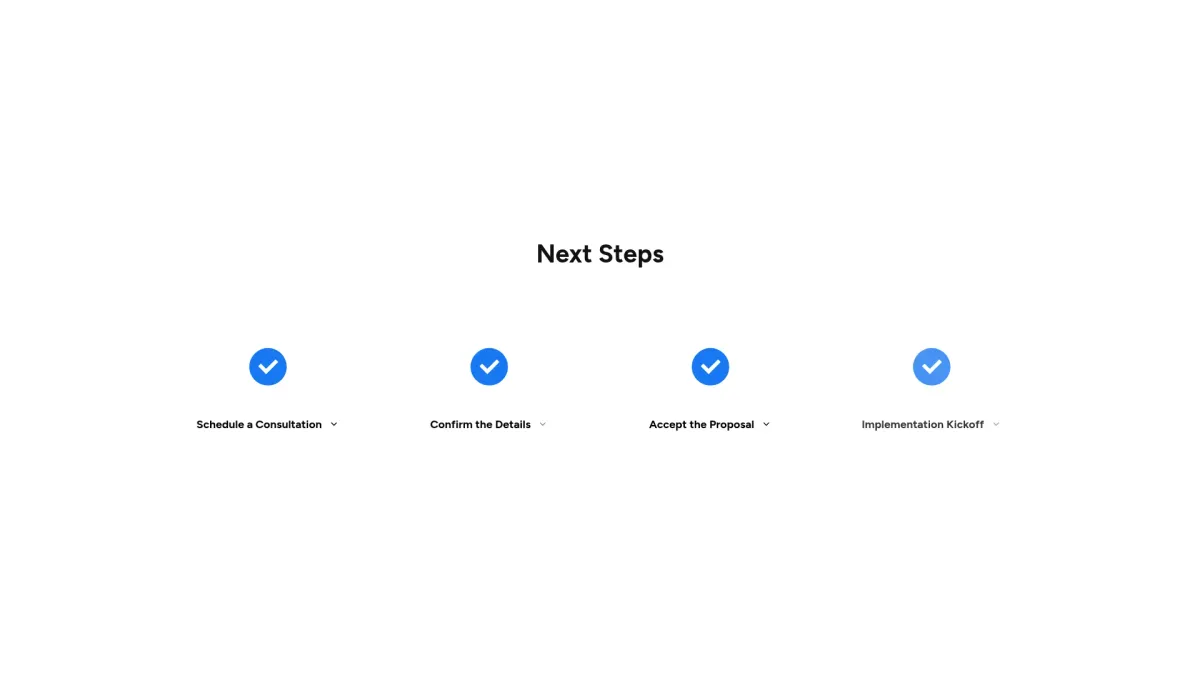
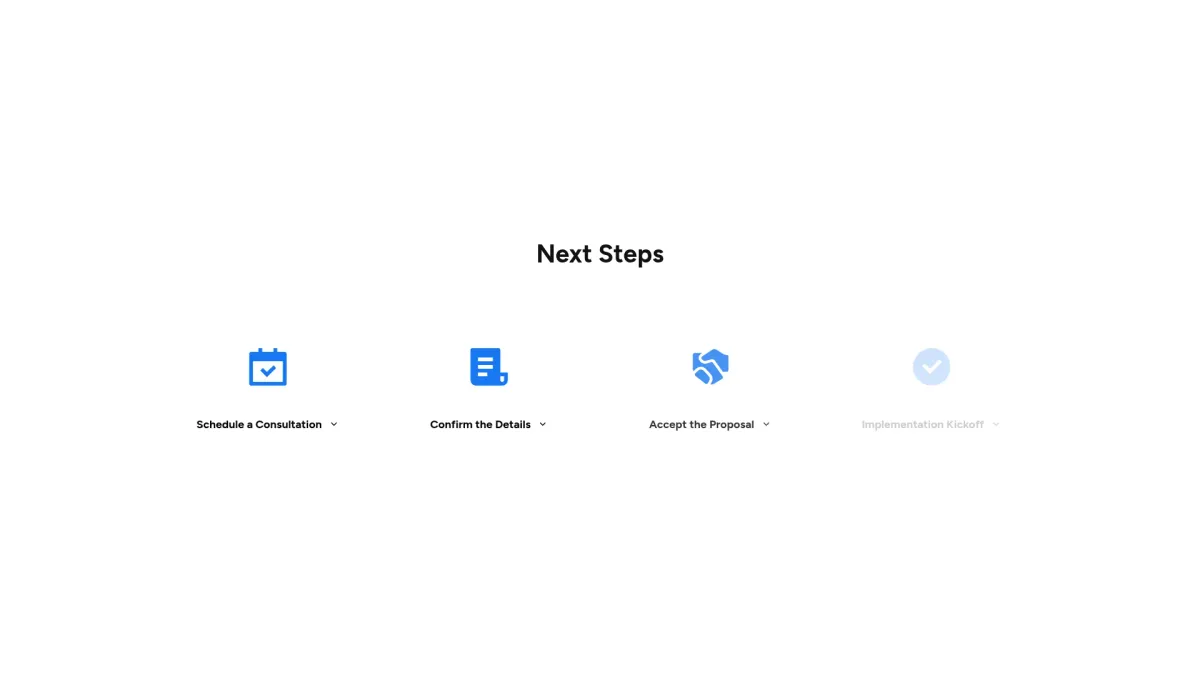
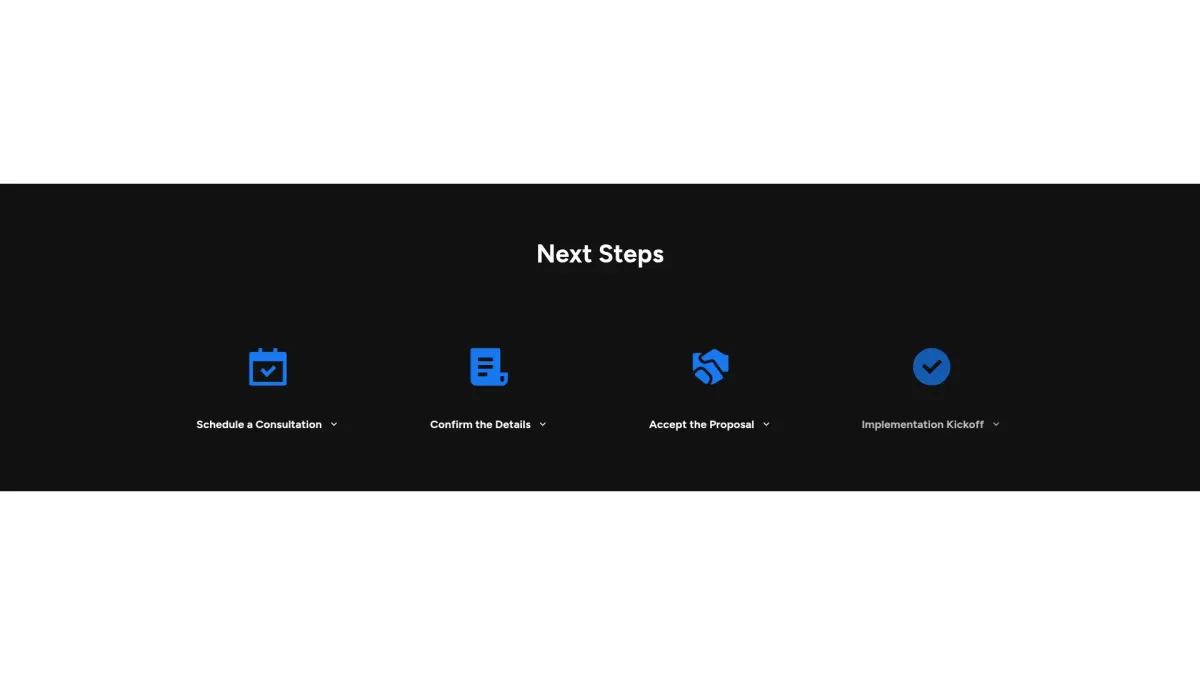
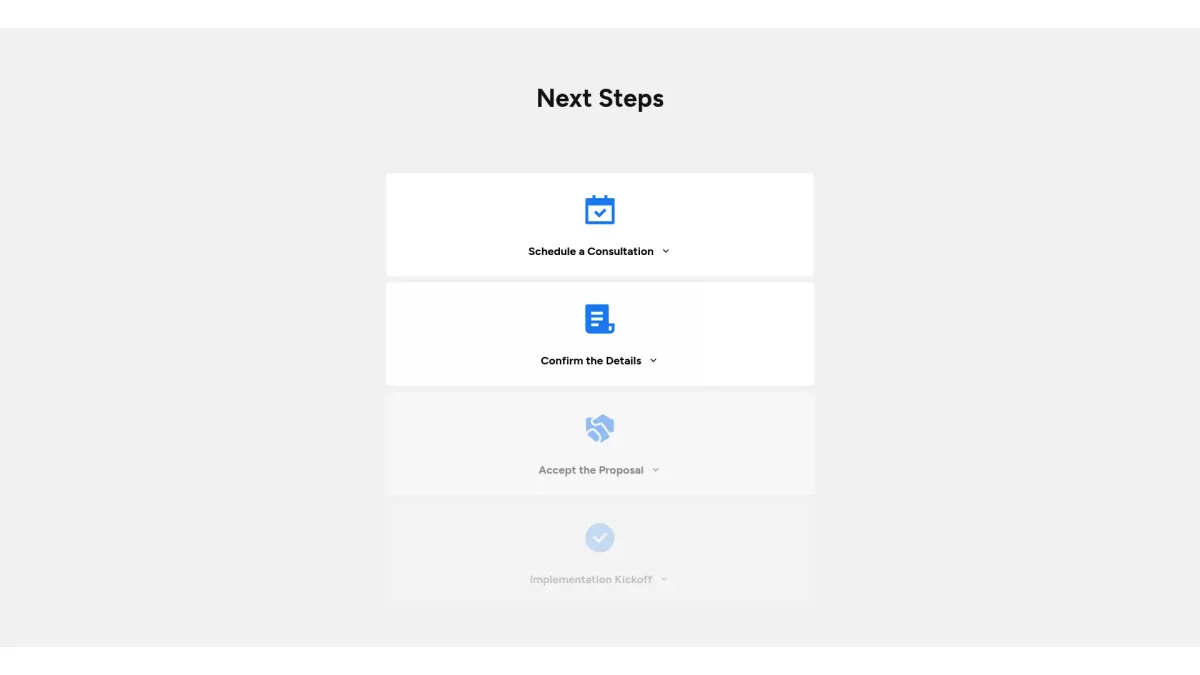
General timeline slide
Choose the general timeline slide layout you love most. Grab an interactive template that streamlines planning and clarifies communication.
Customize slide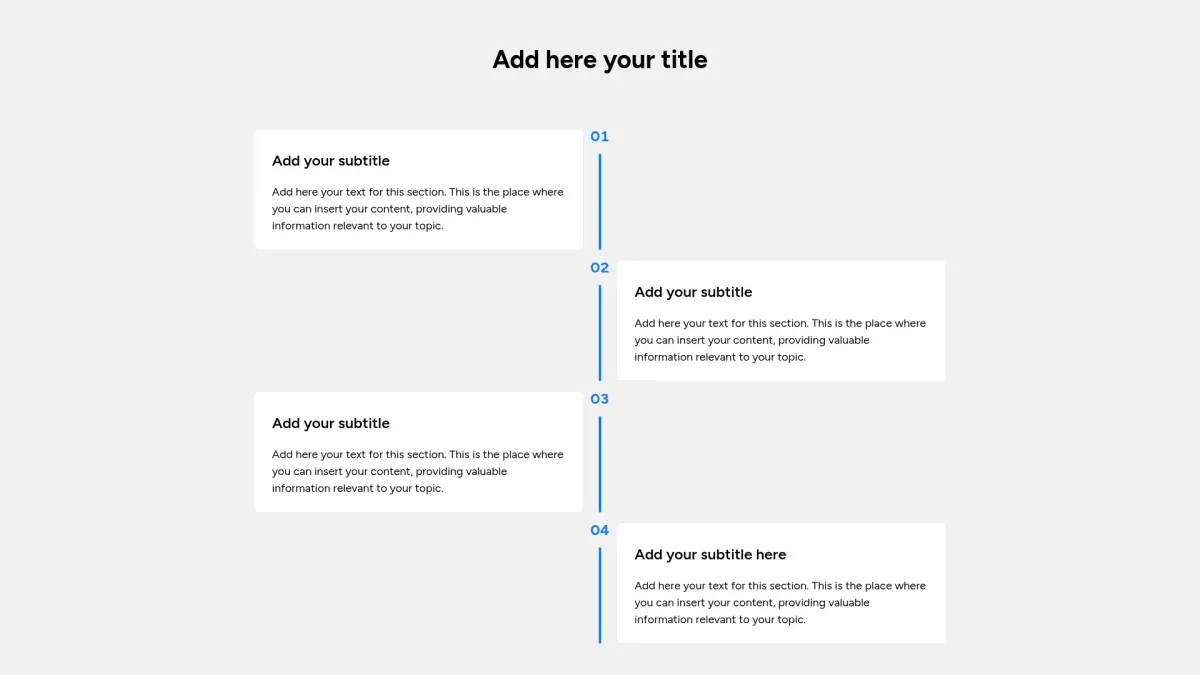
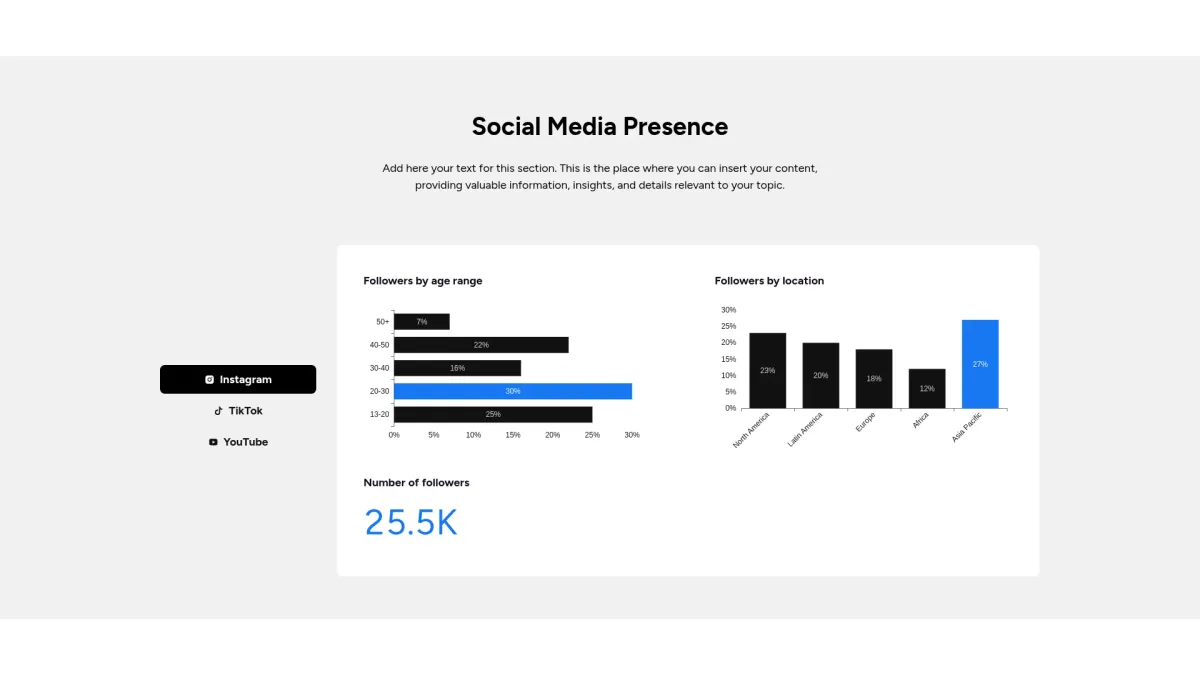
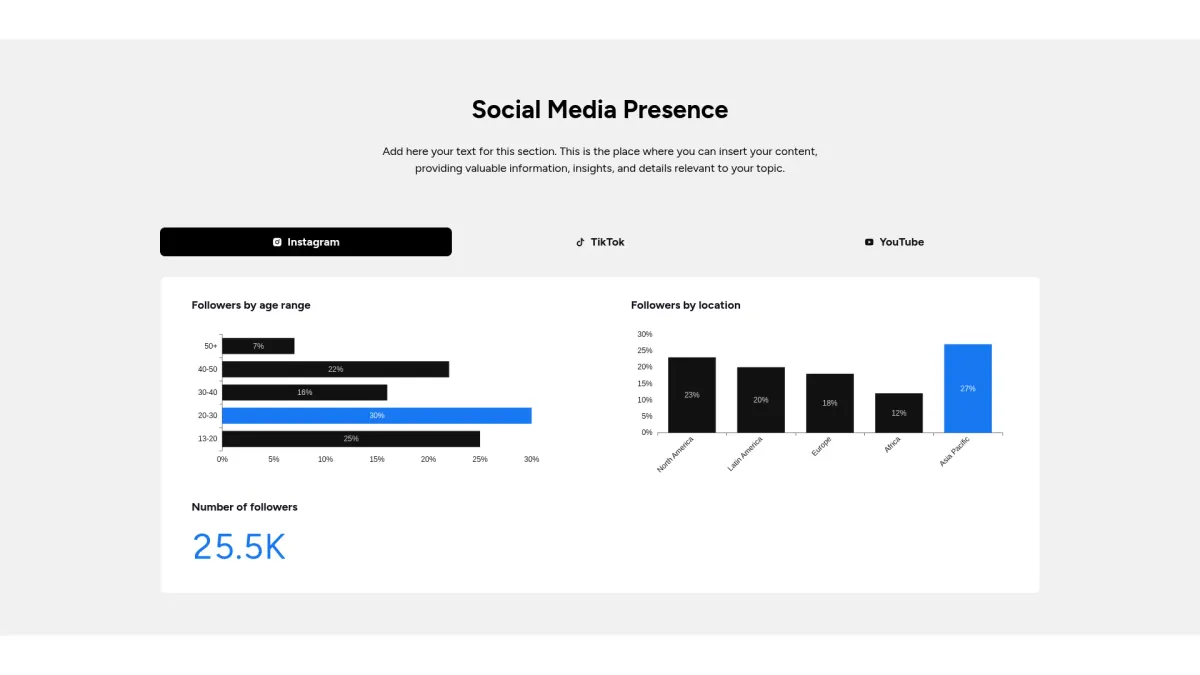
Target audience slide
Choose the target audience slide layout you love most. Grab an interactive template that sharpens audience focus and boosts strategic messaging.
Customize slide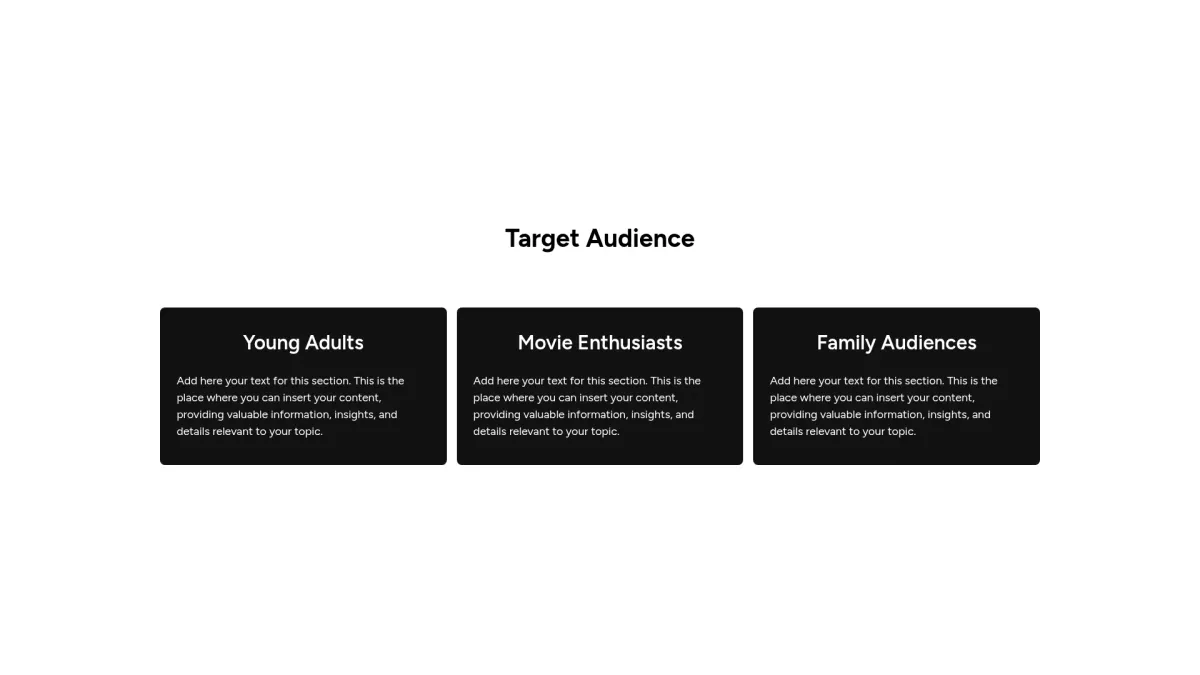
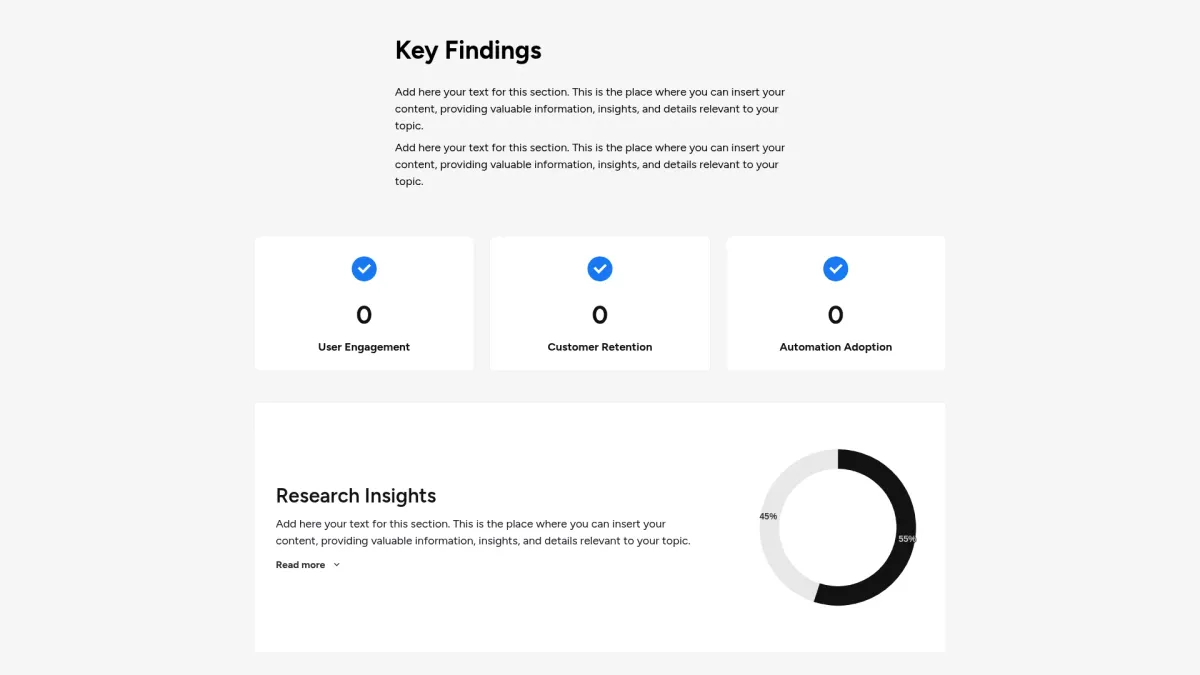
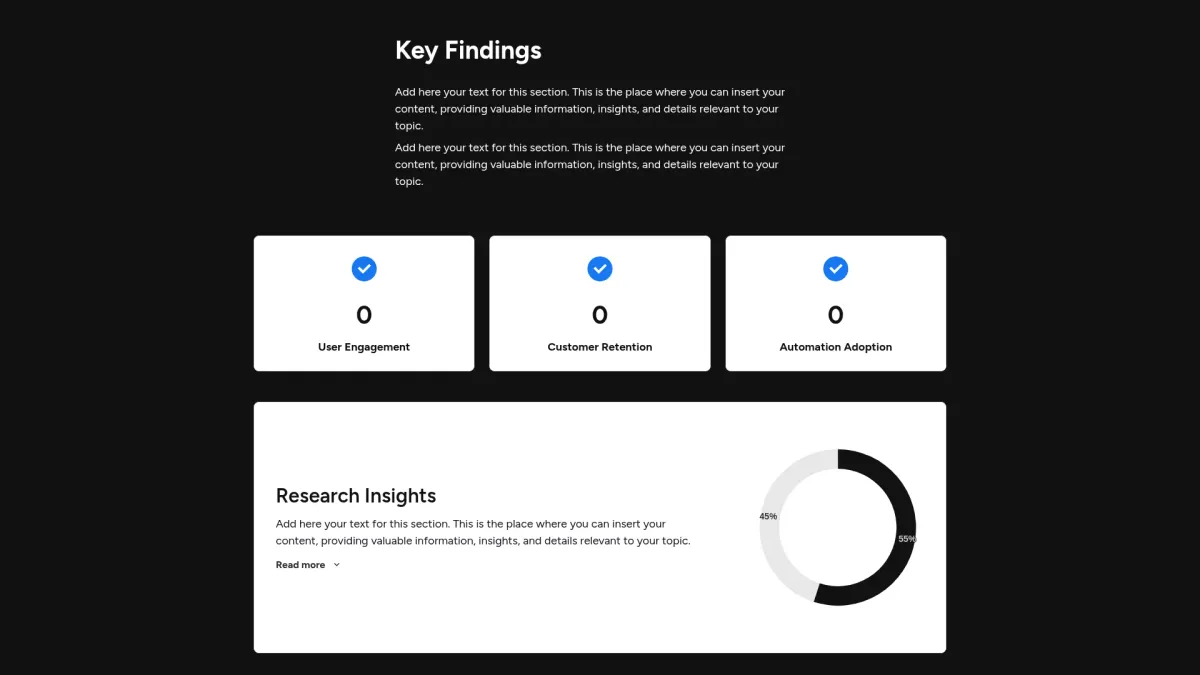
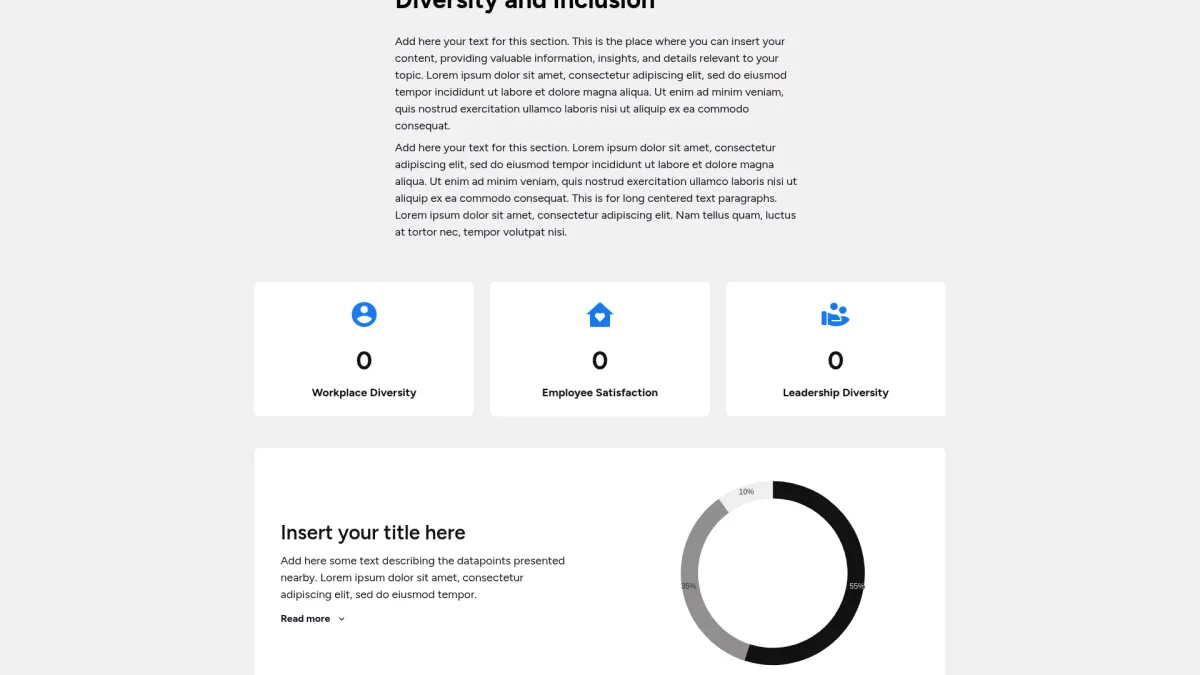
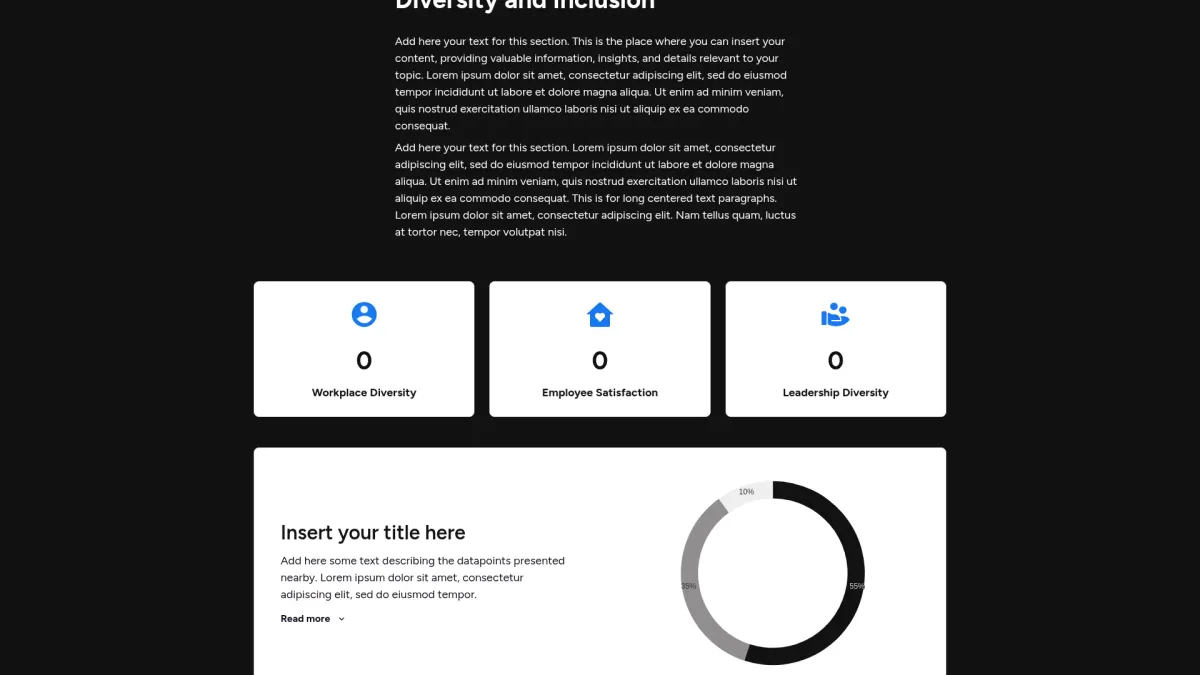
General KPIs slide
Choose the general KPIs slide layout you love most. Grab an interactive general KPIs slide template that streamlines data presentation and enhances audience engagement
Customize slide
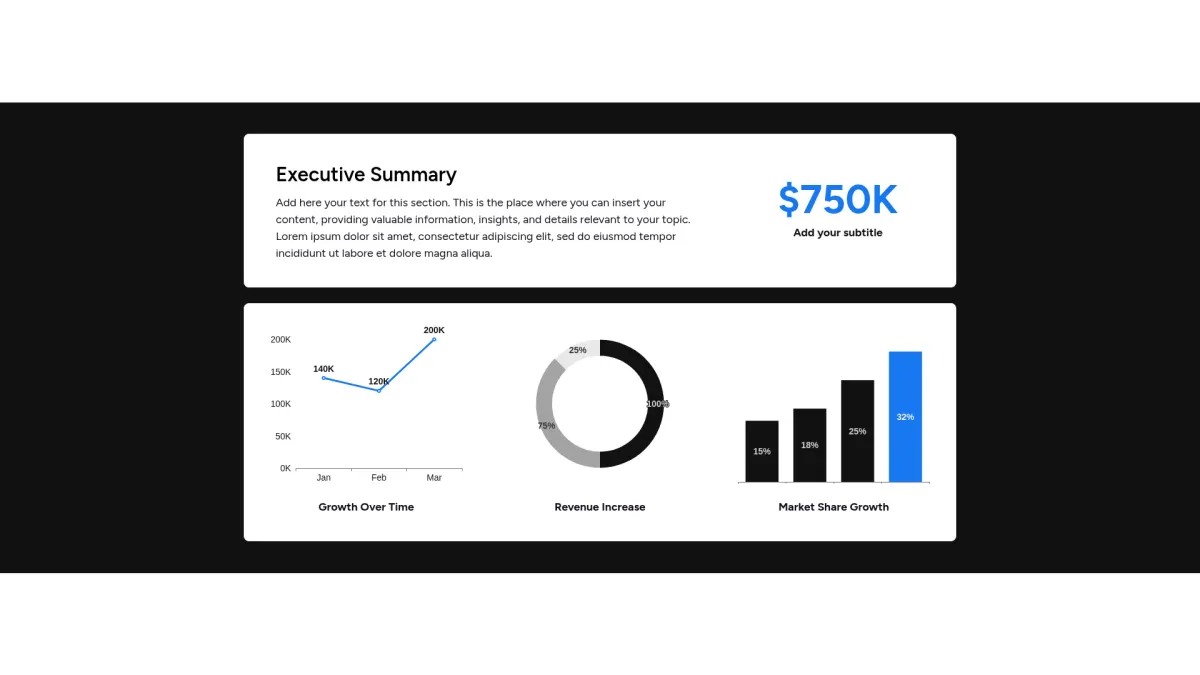
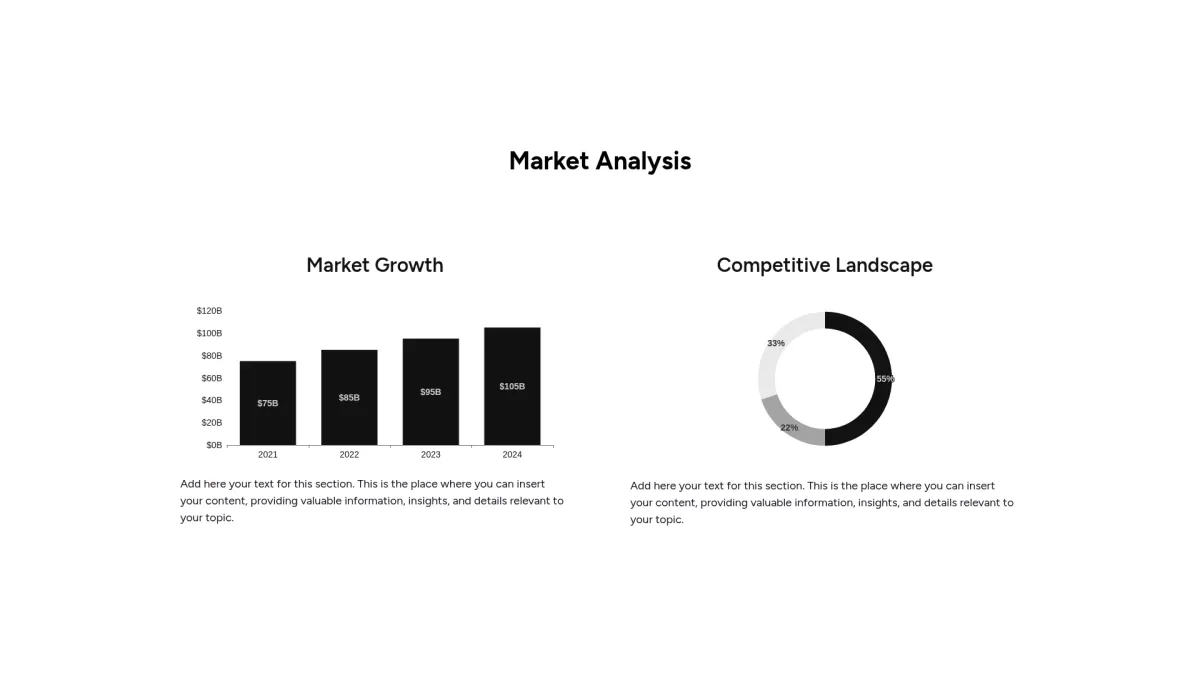
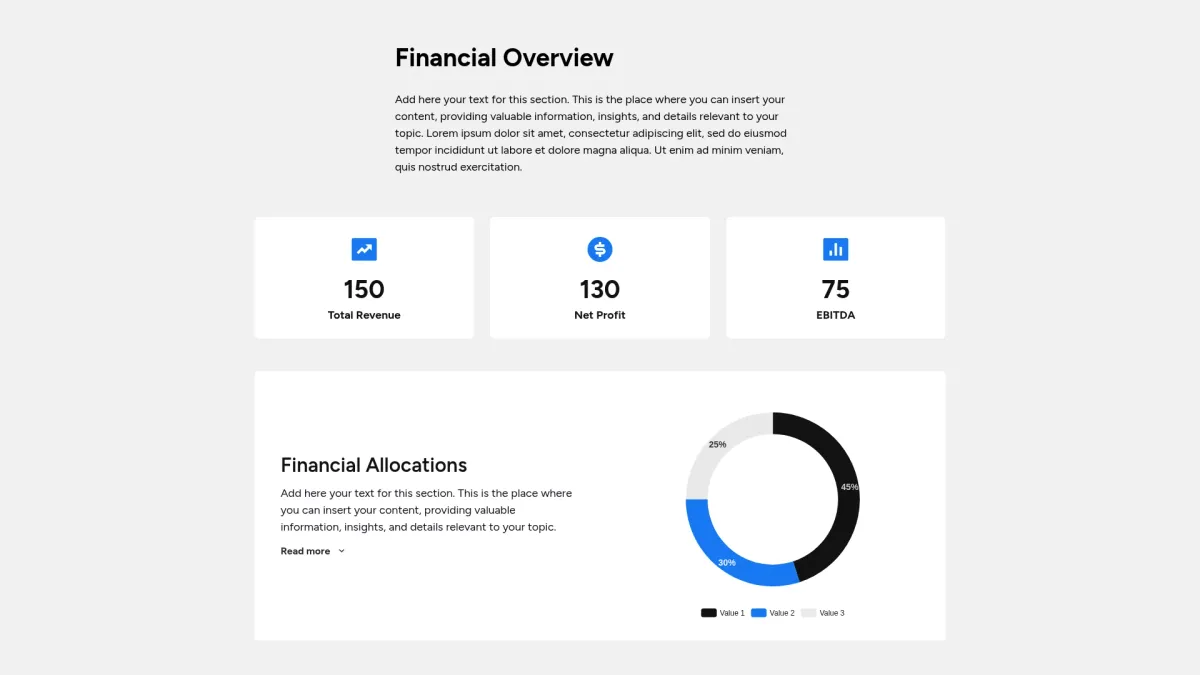
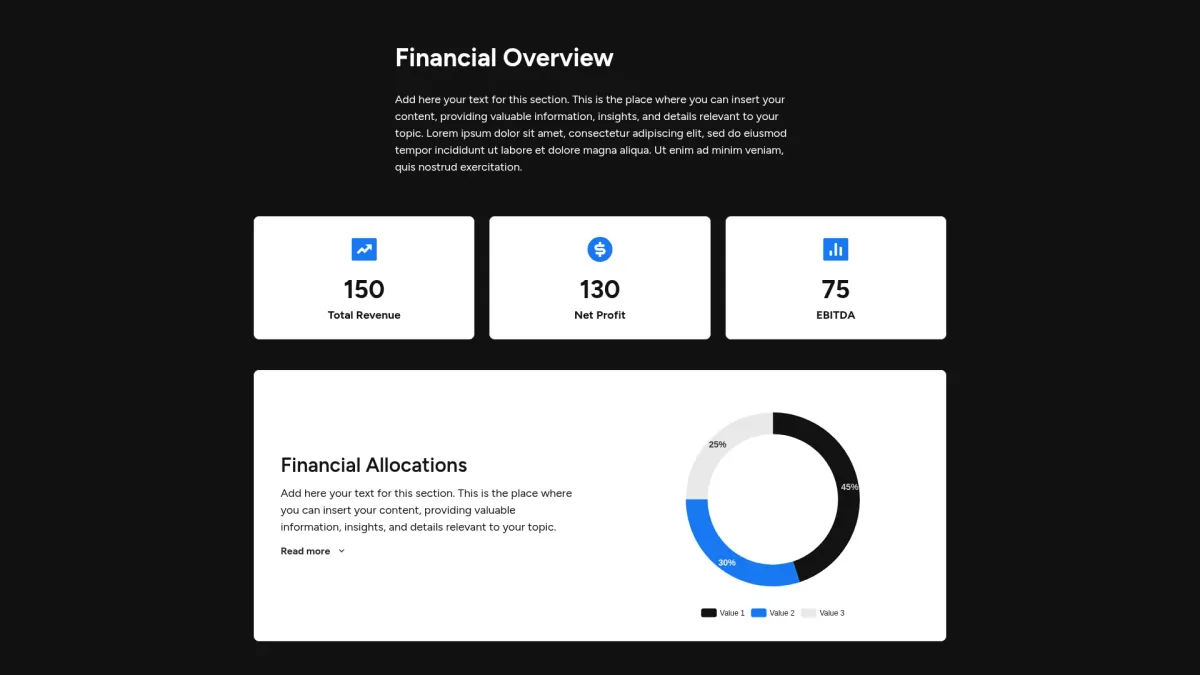
Executive summary dashboard slide
Choose the executive summary dashboard slide layout you love most. Grab an interactive template that boosts clarity and drives smart decision-making.
Customize slide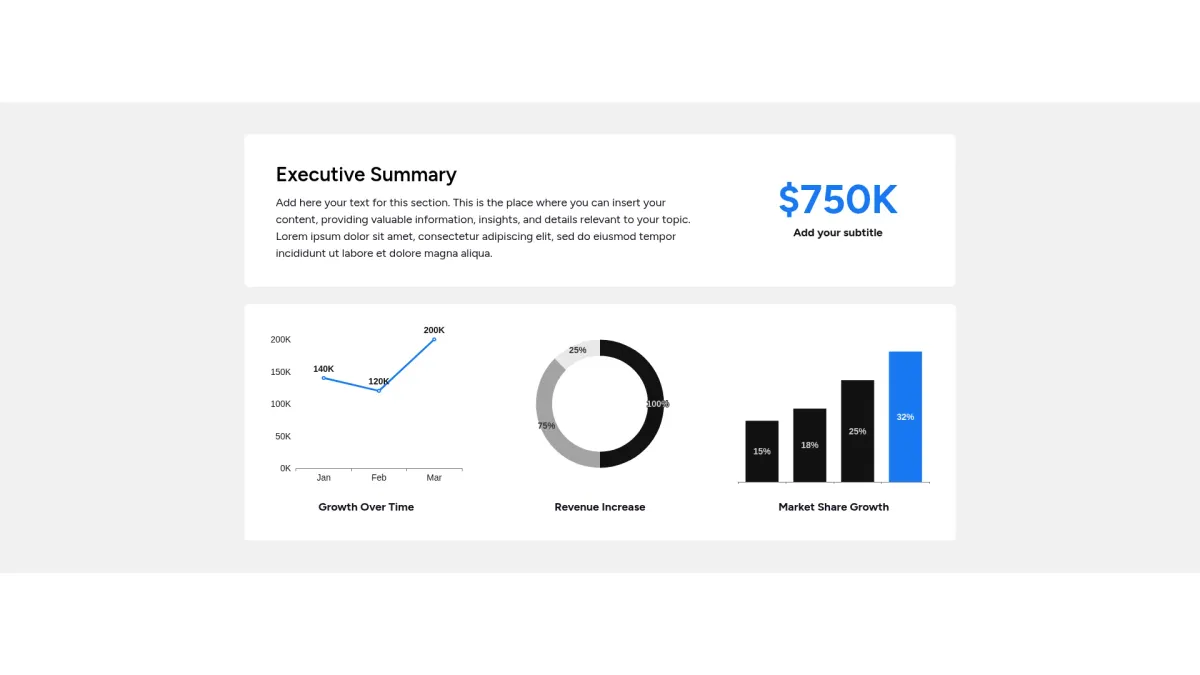


FAQ
What are charts and graphs?
What are charts and graphs?
Charts and graphs slides are customizable templates designed for data visualization. They serve business professionals, analysts, and educators by providing automated AI writing and design. These slides support presentations, reports, and pitches for industries including finance, marketing, and education, ensuring clear graphical display of key metrics and trends with precision.
What is the goal of charts and graphs?
What is the goal of charts and graphs?
The goal of charts and graphs is to streamline data presentation and enhance clarity. They enable users to analyze patterns, trends, and results, driving informed decisions and improving communication across diverse professional settings with ease.
What do charts and graphs templates include?
What do charts and graphs templates include?
A charts and graphs template typically includes:
- Automated AI writing and design for effective content.
- Customizable layouts for clear, effective visual communication always.
- Pre-built data charts for quick integration and ease.
- Editable graph elements to represent dynamic data accurately.
- Interactive charts enabling real-time data updates with ease.
- Robust analytics integration for comprehensive performance review system.
How to tailor your slide with AI?
How to tailor your slide with AI?
Once chosen, Storydoc provides all available layouts and forms that slide can adopt. Write a concise prompt directing Storydoc’s AI for content and design adjustments. Refine colors, fonts, and layouts to achieve tailored, interactive, mobile-friendly, and professional slides effectively. Customize each element meticulously, ensuring superior engagement and functionality for success.
What makes Storydoc slides better than static slides?
What makes Storydoc slides better than static slides?
Notably, these features combine to elevate user presentation experiences.
- Interactivity enhancing user engagement and retention.
- Drag-and-drop simplicity for quick edits.
- AI customization providing smart design improvements.
- Personalization ensuring brand consistency and relevance.
- Automated design for efficient slide creation.
- AI assistants offering real-time creative support.
- Analytics to measure performance and impact.
Why use Storydoc instead of paying an agency?
Why use Storydoc instead of paying an agency?
Storydoc enables you to create slides twice as engaging as agency-made versions at a fraction of cost. It speeds up production, eliminates repetitive revisions, and gives you complete control. You can quickly update content and design, ensuring flexibility, security, and ongoing refinement. Experience efficient slide creation and total creative autonomy.
Start working on your charts and graphs with our AI presentation maker

Make charts and graphs that get the job done
Stop losing opportunities to ineffective documents.
Try Storydoc now.