KPIs slide templates
that drives smart performance
Choose the KPIs slide layout you love most. Grab an interactive KPIs slide template that elevates data insight and drives smarter decision-making.
Objectives slide
Choose the objectives slide layout you love most. Grab an interactive objectives slide template that enhances your strategic focus for better results.
Customize slide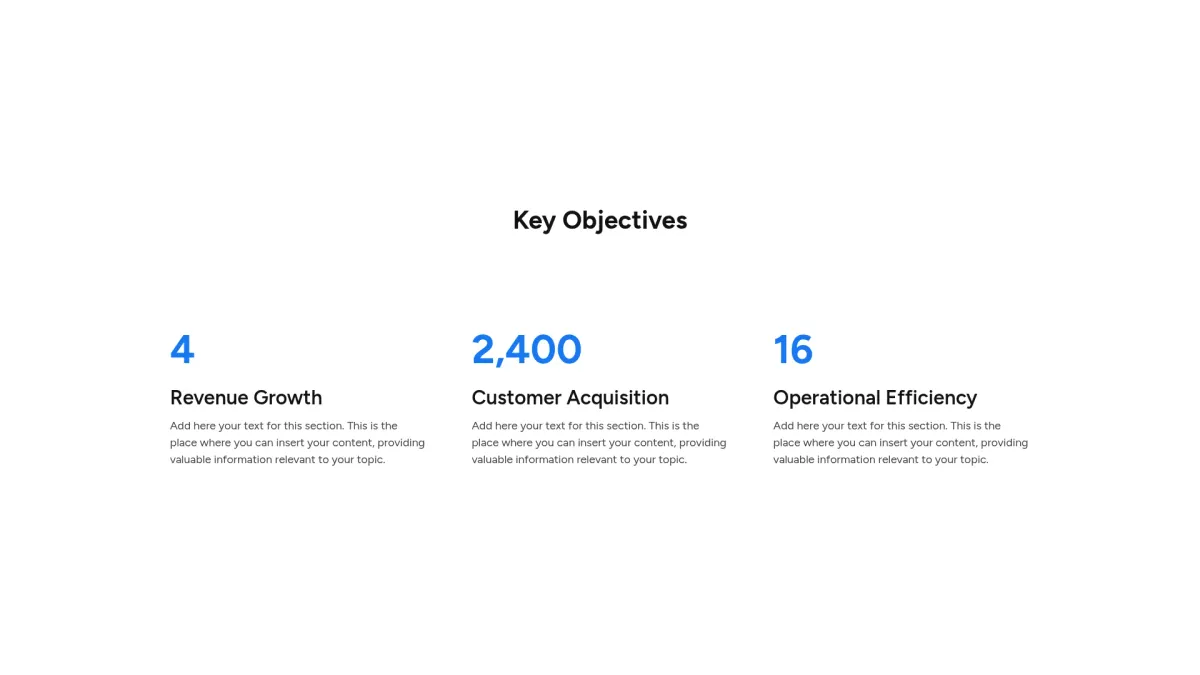
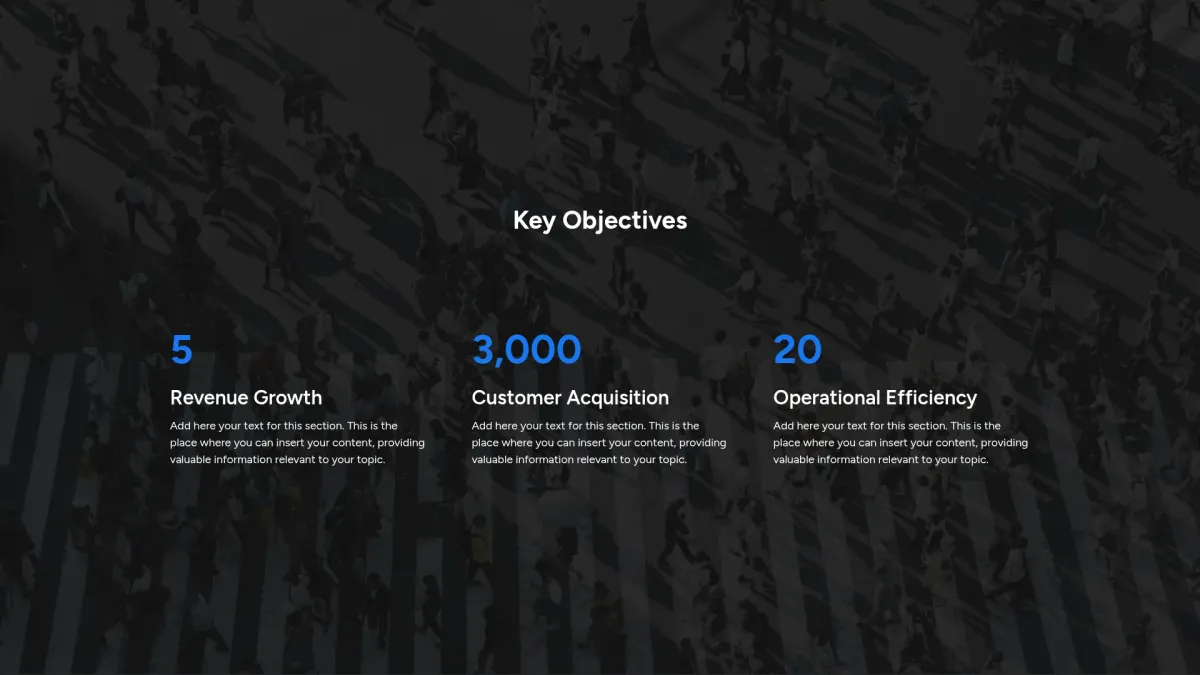
General KPIs slide
Choose the general KPIs slide layout you love most. Grab an interactive general KPIs slide template that streamlines data presentation and enhances audience engagement
Customize slide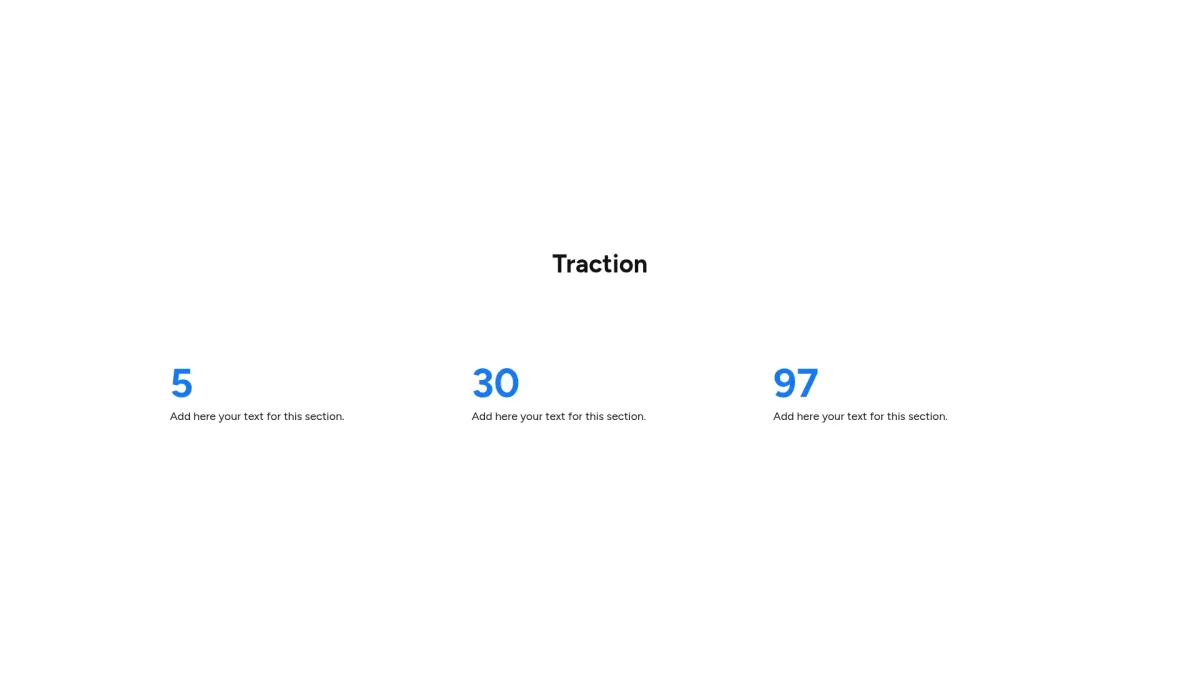

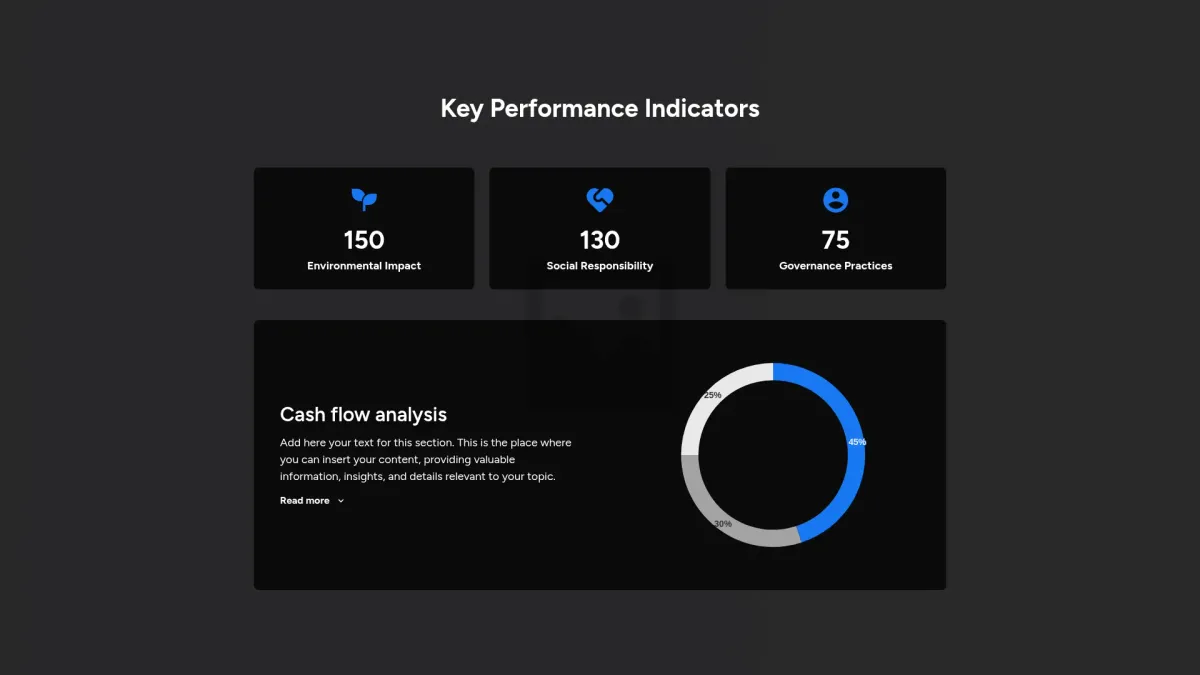
ESG KPIs slide
Choose the ESG KPIs slide layout you love most. Grab an interactive ESG KPIs slide template that boosts clarity and streamlines your reporting.
Customize slide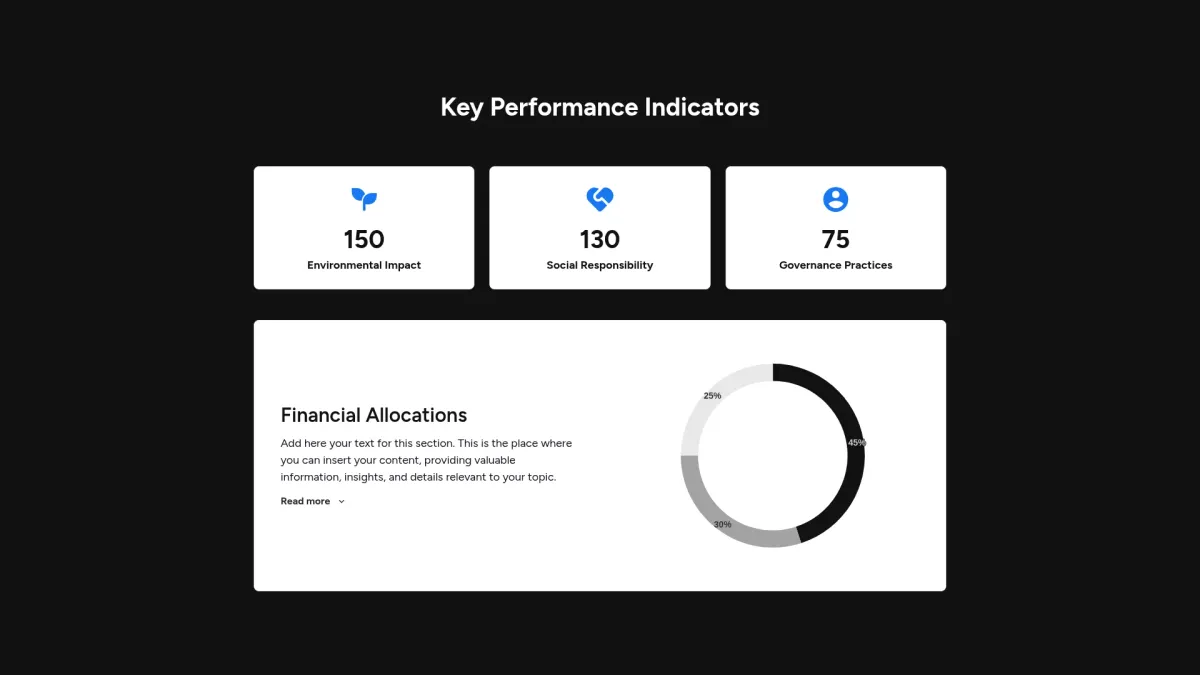
Sports team KPIs slide
Choose the sports team KPIs slide layout you love most. Grab a sports team KPIs slide template that boosts clarity in performance reporting now.
Customize slide
FAQ
What are KPIs slide?
What are KPIs slide?
KPIs slide templates fall within business presentation documents. They are designed for visualizing key performance indicators critical for organizational analysis. These slides cater to business leaders, analysts, and marketing teams. Industries such as finance, technology, and healthcare benefit from these customizable, AI-powered templates. Elevate strategic presentations and informed decisions consistently.
What is the goal of KPIs slide?
What is the goal of KPIs slide?
The goal of KPIs slide templates is to enable clear data visualization, strategic insights, and efficient performance monitoring while enhancing decision-making processes. They empower you to communicate metrics effectively and drive measurable business performance outcomes.
What do KPIs slide templates include?
What do KPIs slide templates include?
A KPIs slide template typically includes:
- Title section prominently displaying performance metrics
- Data visualization charts with interactive elements
- KPI summary table showcasing comparative analysis
- Insight commentary section emphasizing trend evaluations
- Footer with contact info and disclaimers
This simple structure ensures clarity and effective communication of crucial metrics for decision making.
How to tailor your slide with AI?
How to tailor your slide with AI?
Once you select your preferred KPIs slide layout, Storydoc presents various customizable formats. You instruct the AI with a clear prompt to adjust designs, colors, fonts, and layouts. Automated design and text generation craft a tailored slide that meets your specific data presentation and aesthetic requirements for your audience precisely.
What makes Storydoc slides better than static slides?
What makes Storydoc slides better than static slides?
Storydoc slides surpass static versions by integrating seven advantages that boost engagement, creativity, and data-driven decision making effectively.
- Interactivity for engaging user experiences
- Drag-and-drop editing for flexibility
- AI customization for tailored content
- Personalization enhancing audience connection
- Automated design streamlining workflow
- AI assistants for real-time insights
- Advanced analytics improving performance tracking
Why use Storydoc instead of paying an agency?
Why use Storydoc instead of paying an agency?
Storydoc enables creation of engaging KPIs slide decks twice as effective as traditional agency-made slides. It is cost-efficient, accelerates production, and eliminates prolonged feedback cycles. Retain complete control and update your slides anytime, ensuring accuracy and flexibility in presenting performance metrics while saving time and reducing overall project expenditures significantly.
Start working on your KPIs slide with our AI presentation maker

Make a KPIs slide that gets the job done
Stop losing opportunities to ineffective documents.
Try Storydoc now.