Data slides templates
that boosts impactful insights
Choose the data slides layout you love most. Grab an interactive data slides template that boosts data clarity and improves decision accuracy.
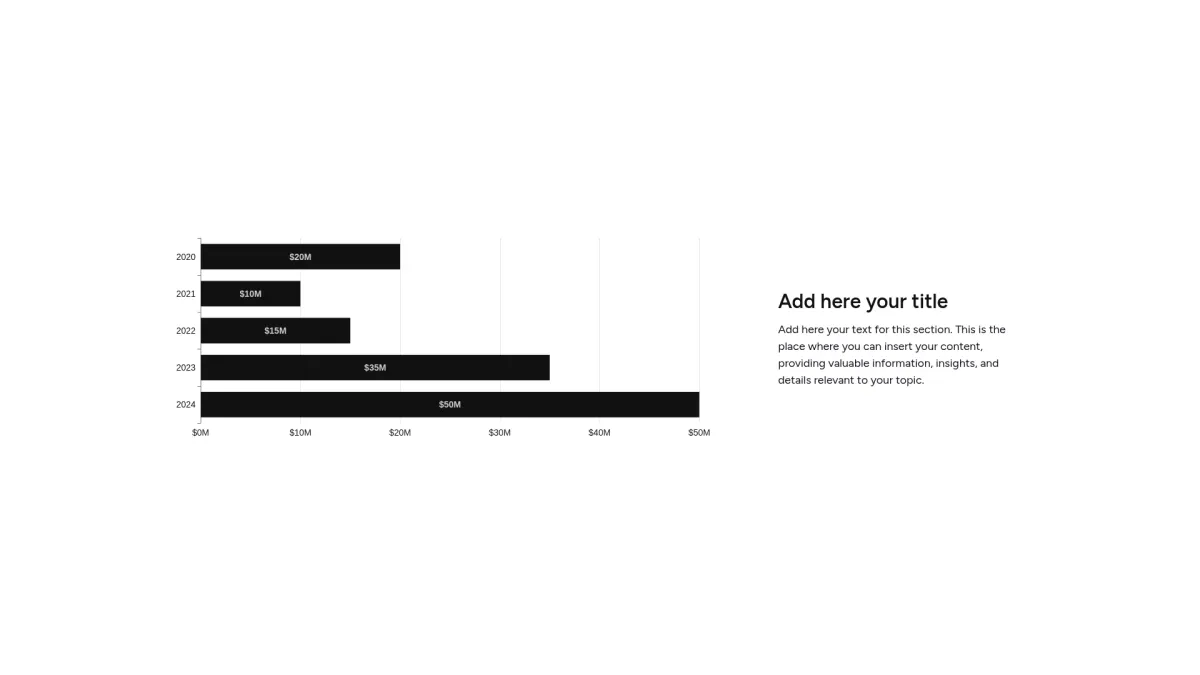
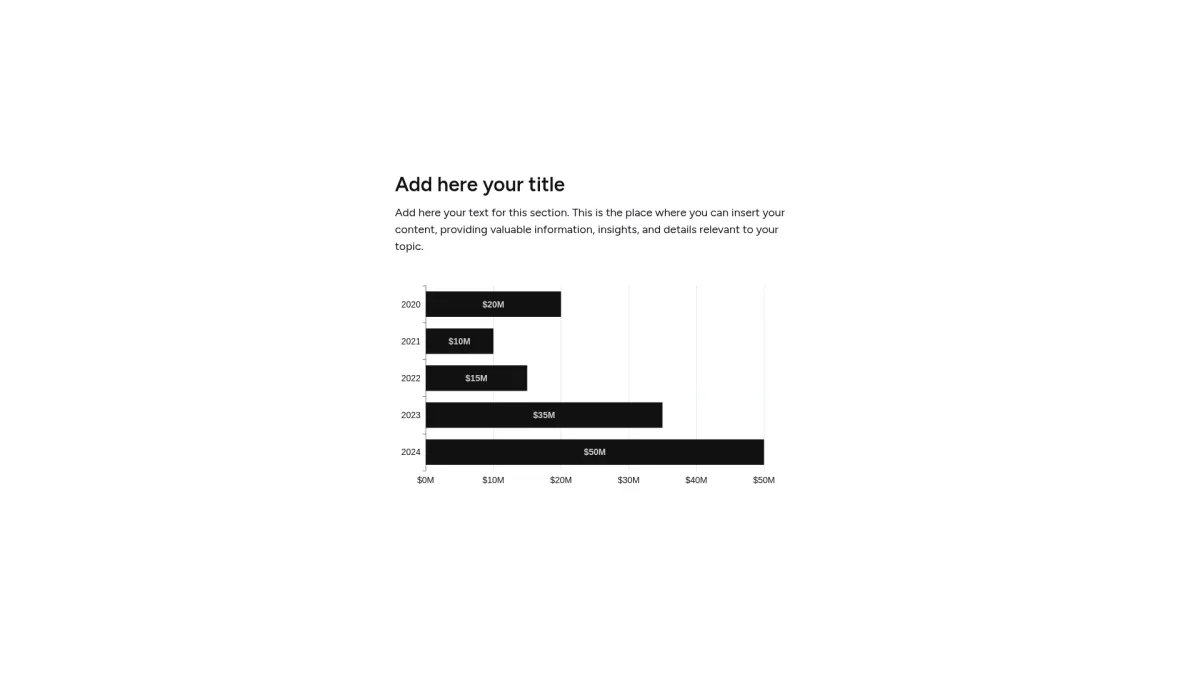
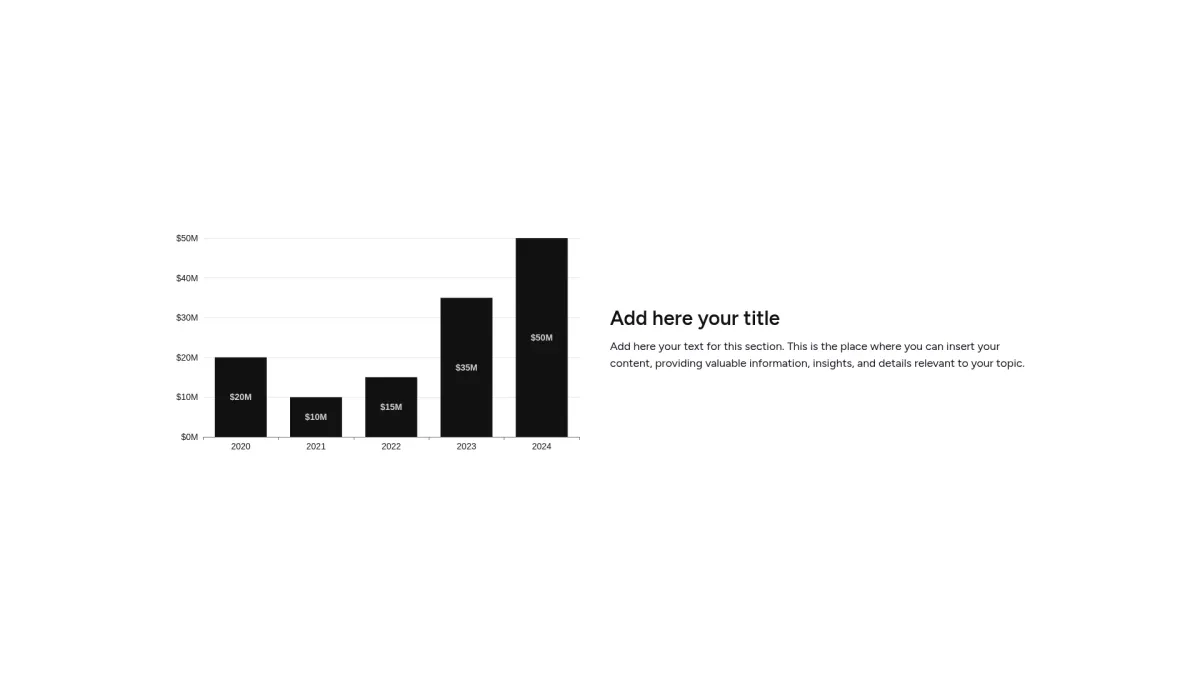
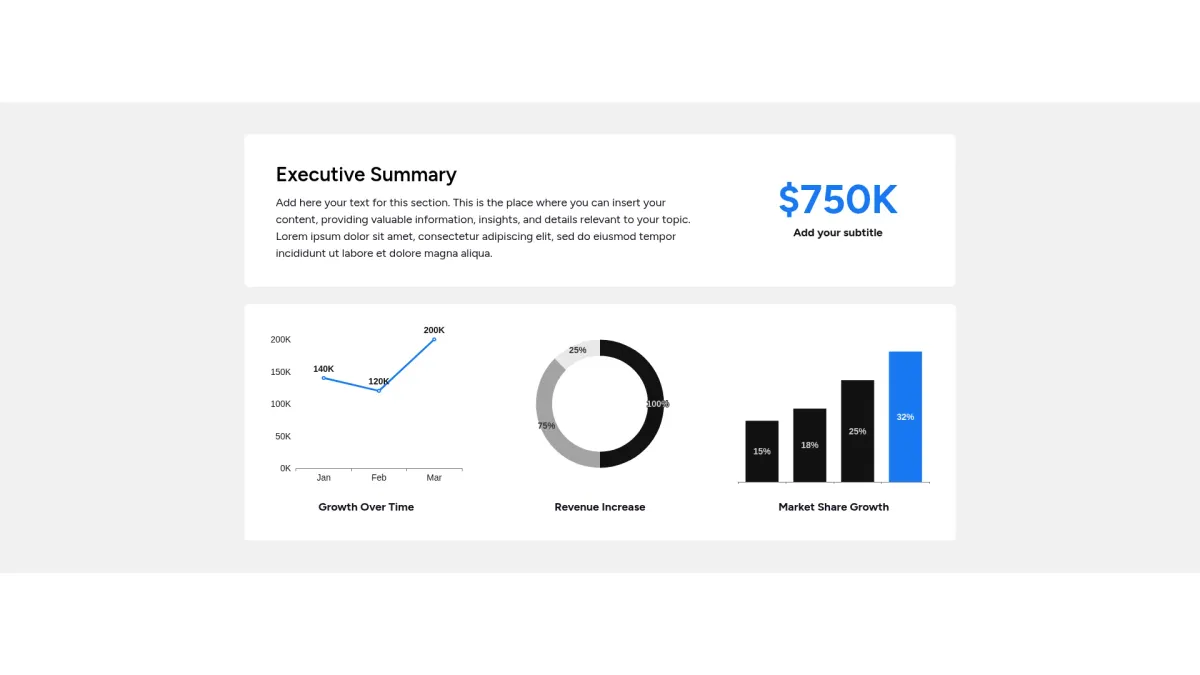
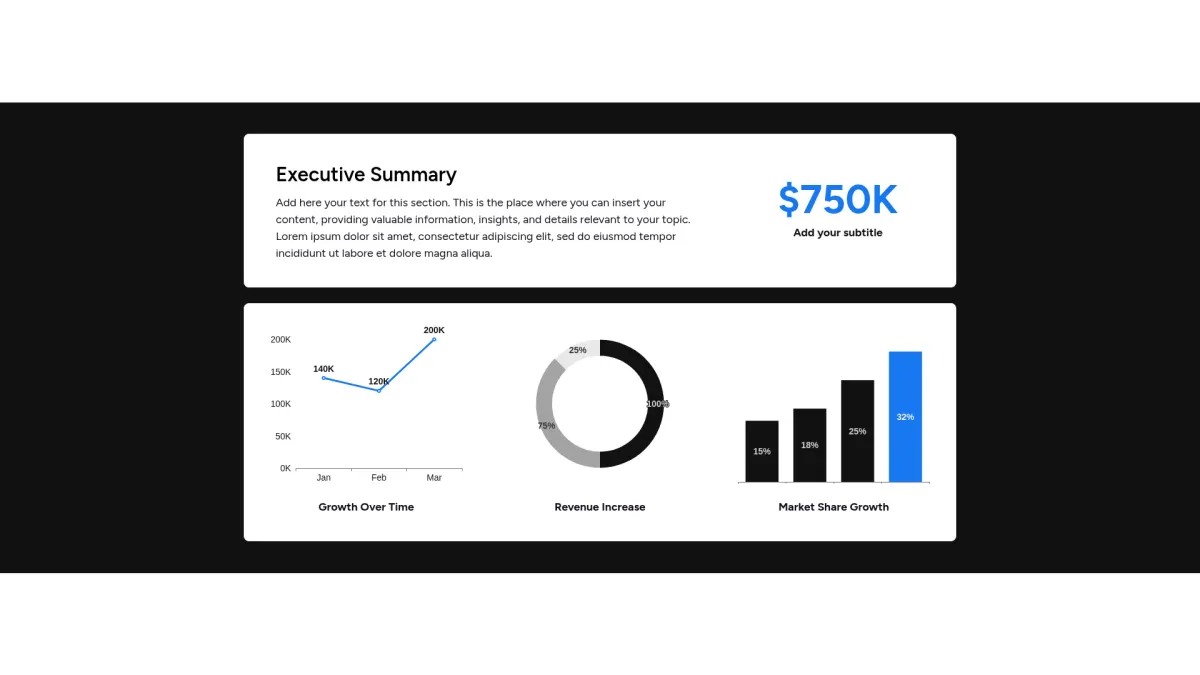
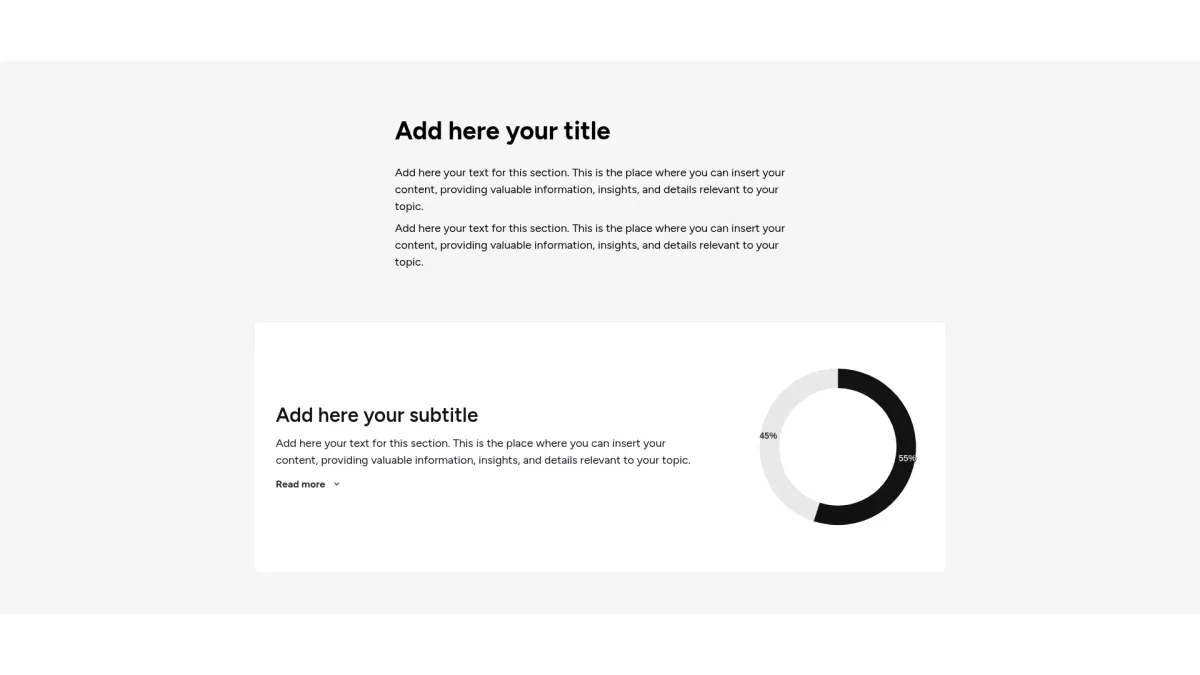
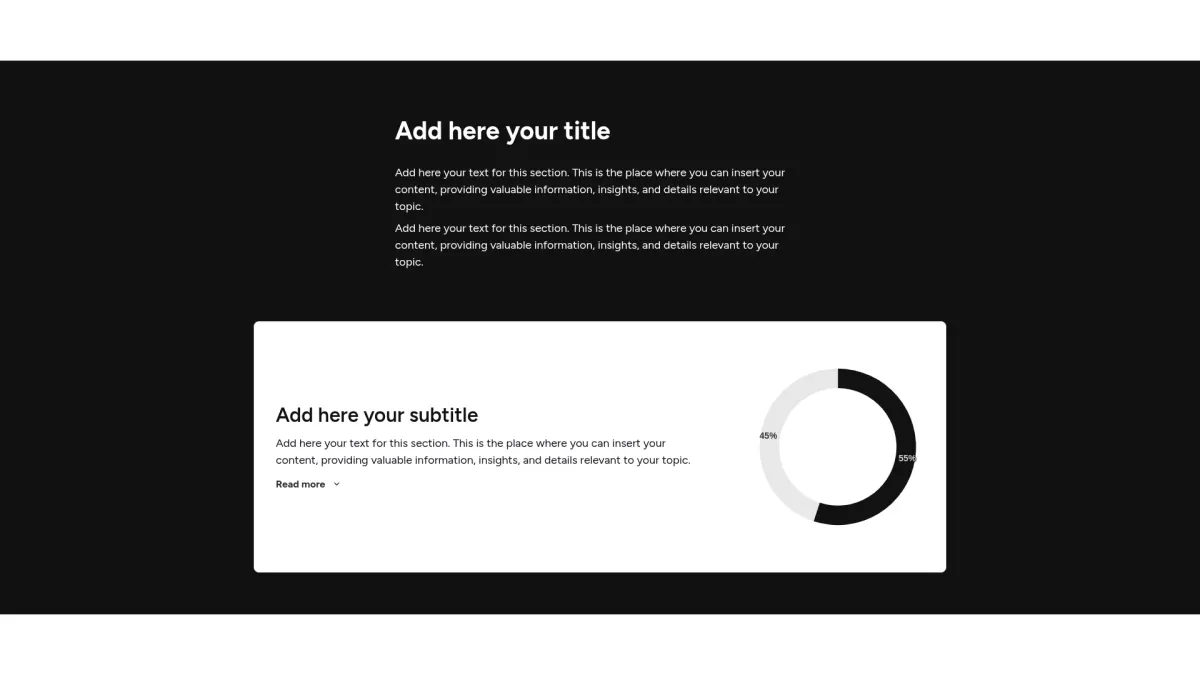
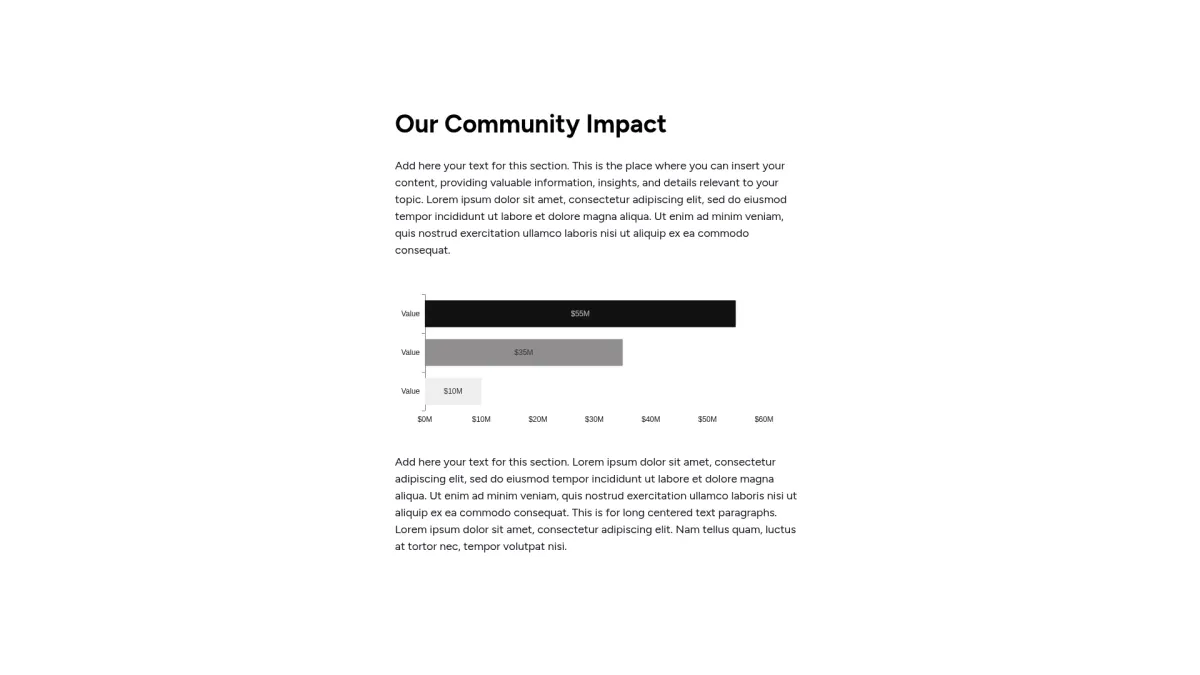
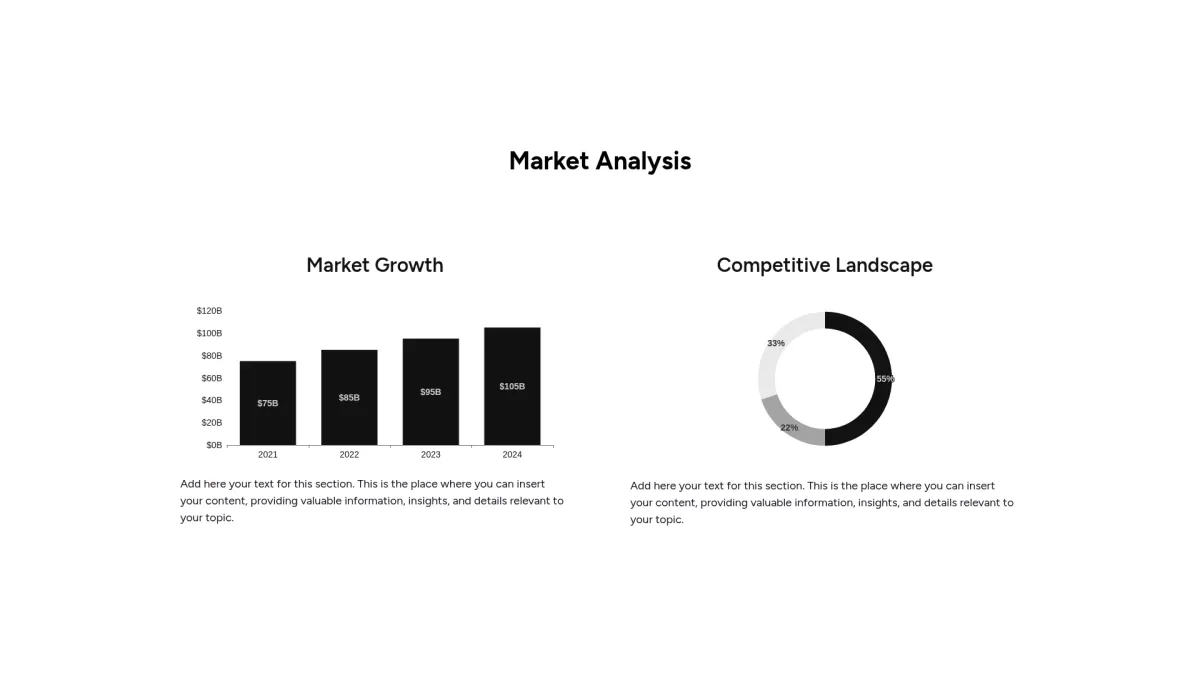
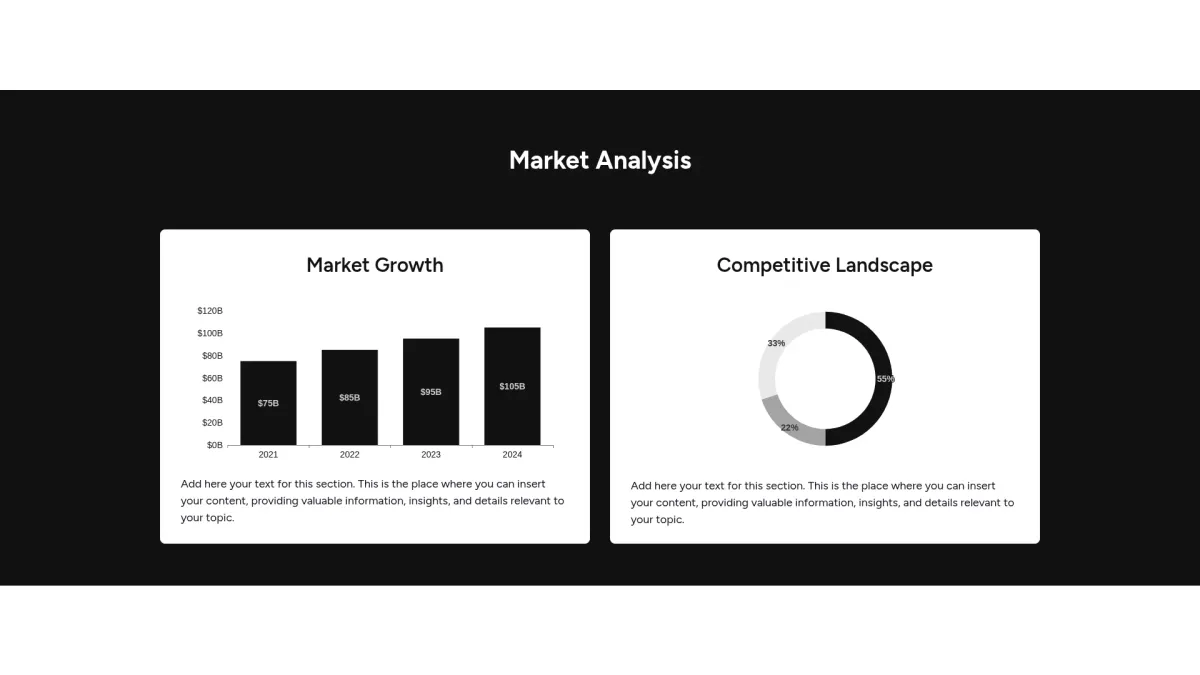
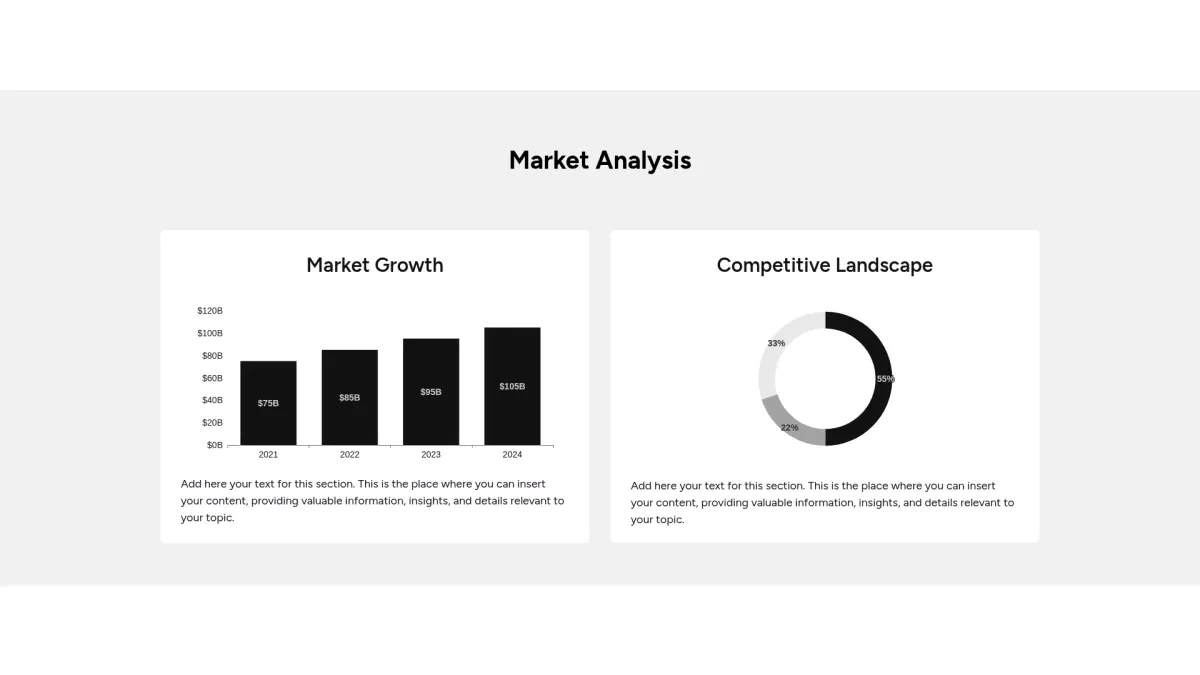
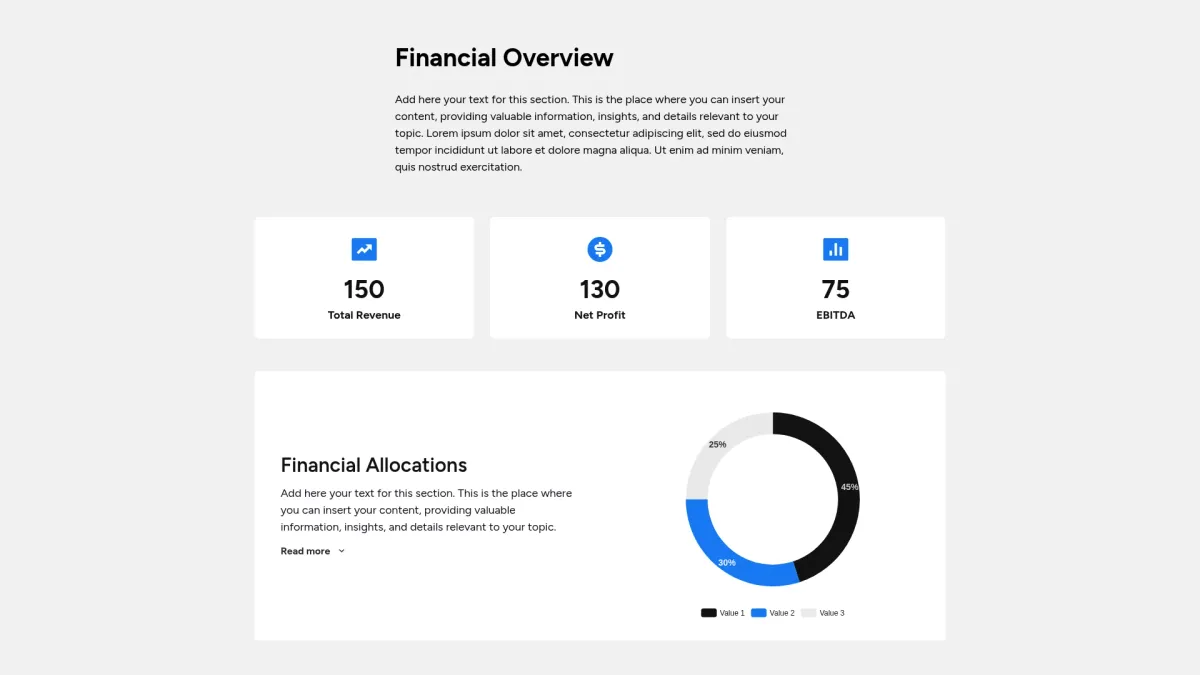
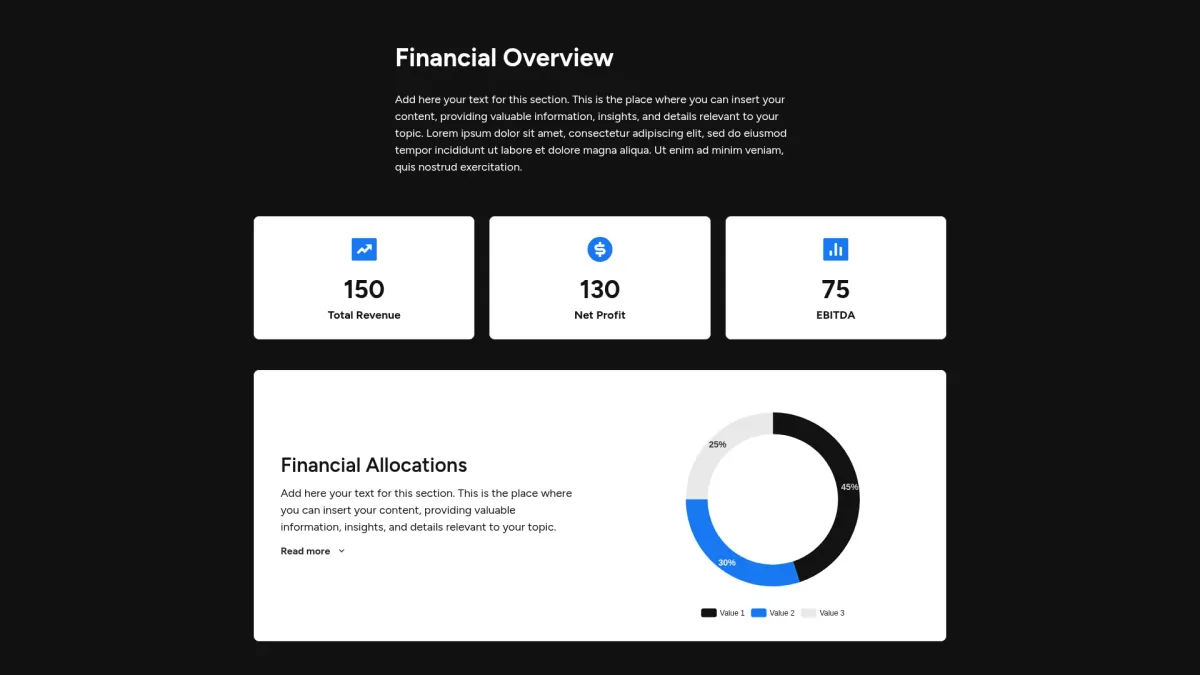
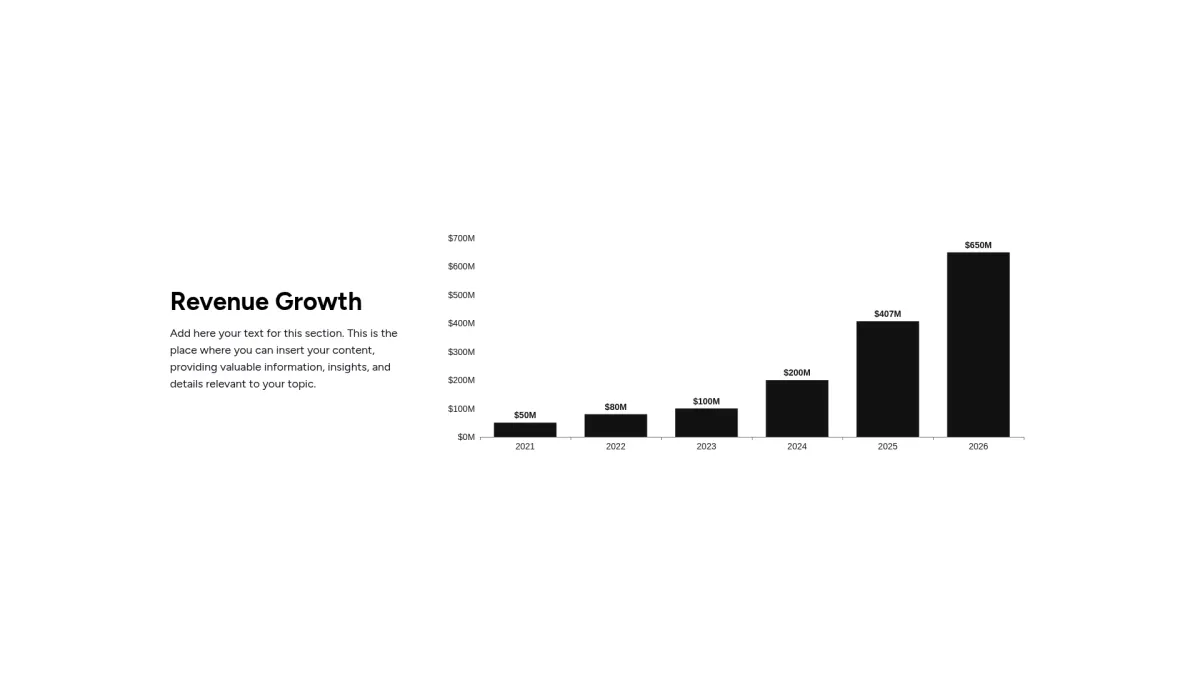
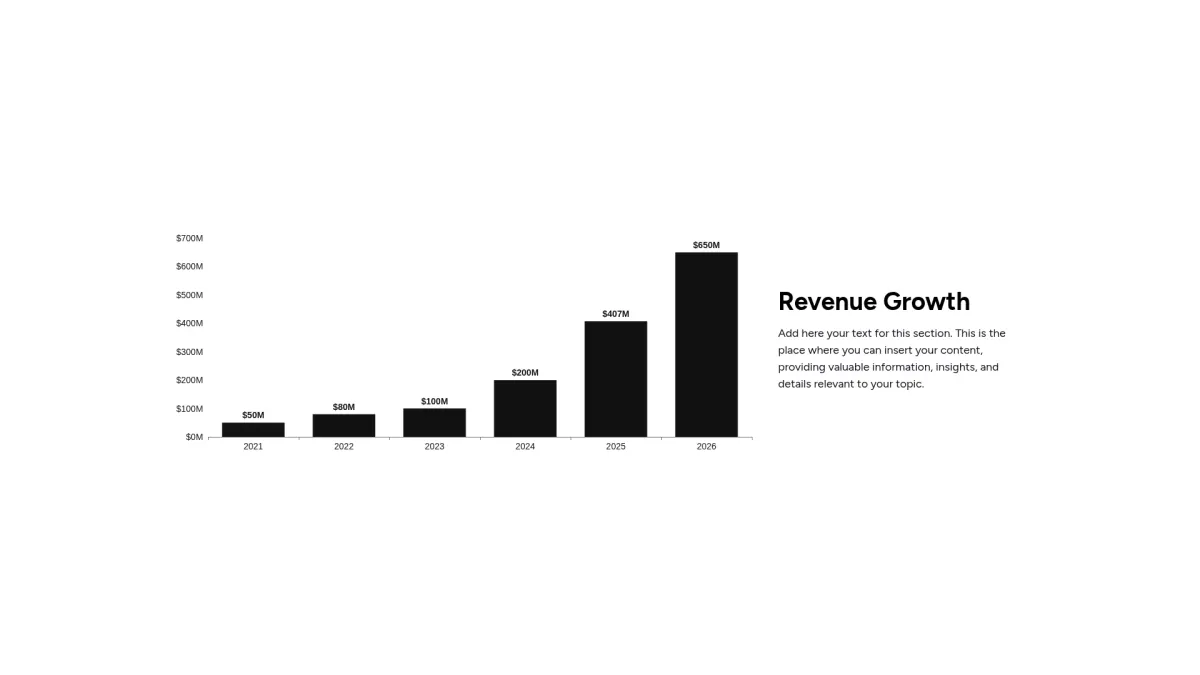
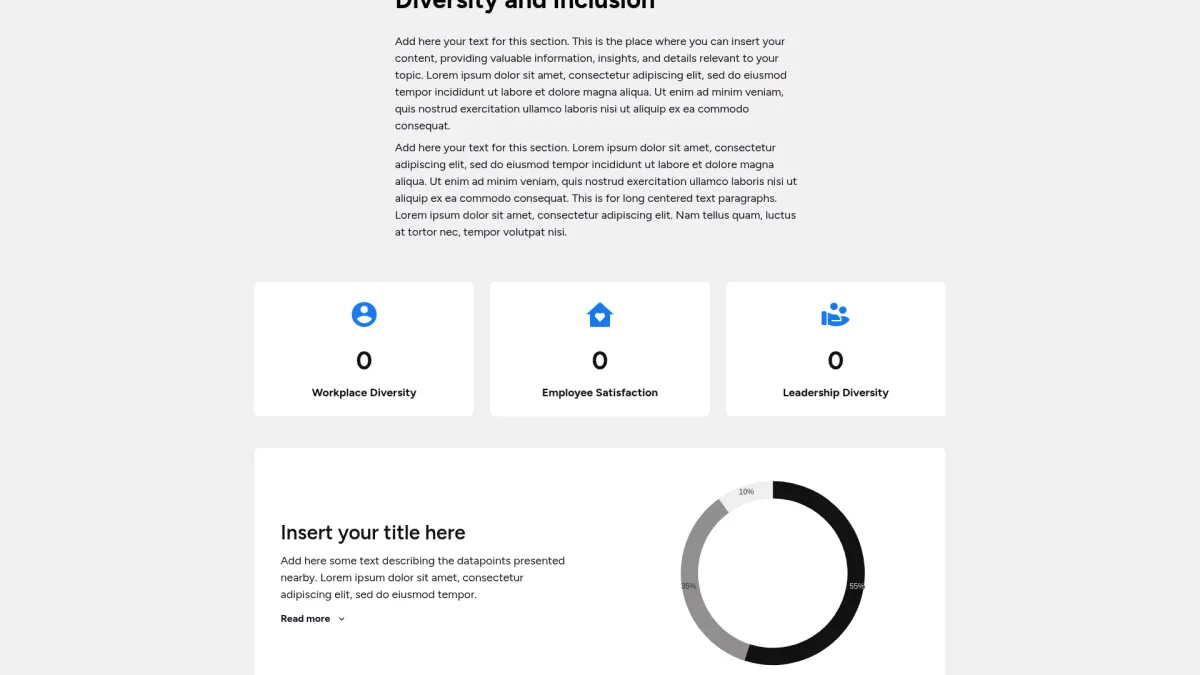
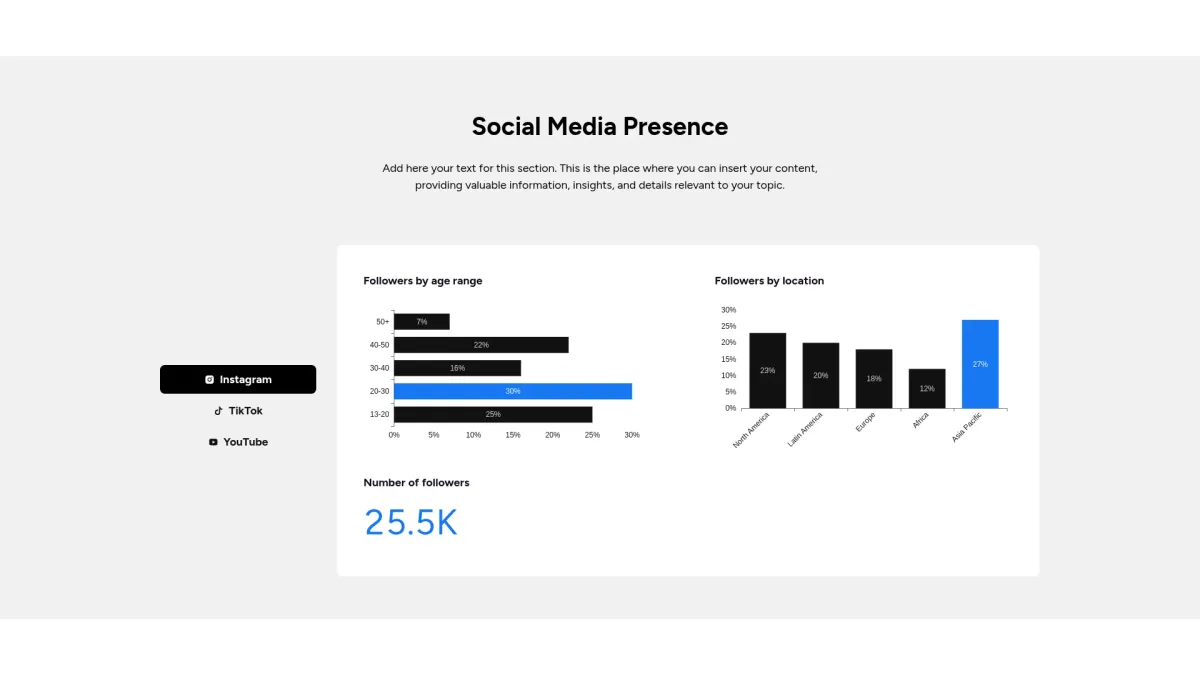
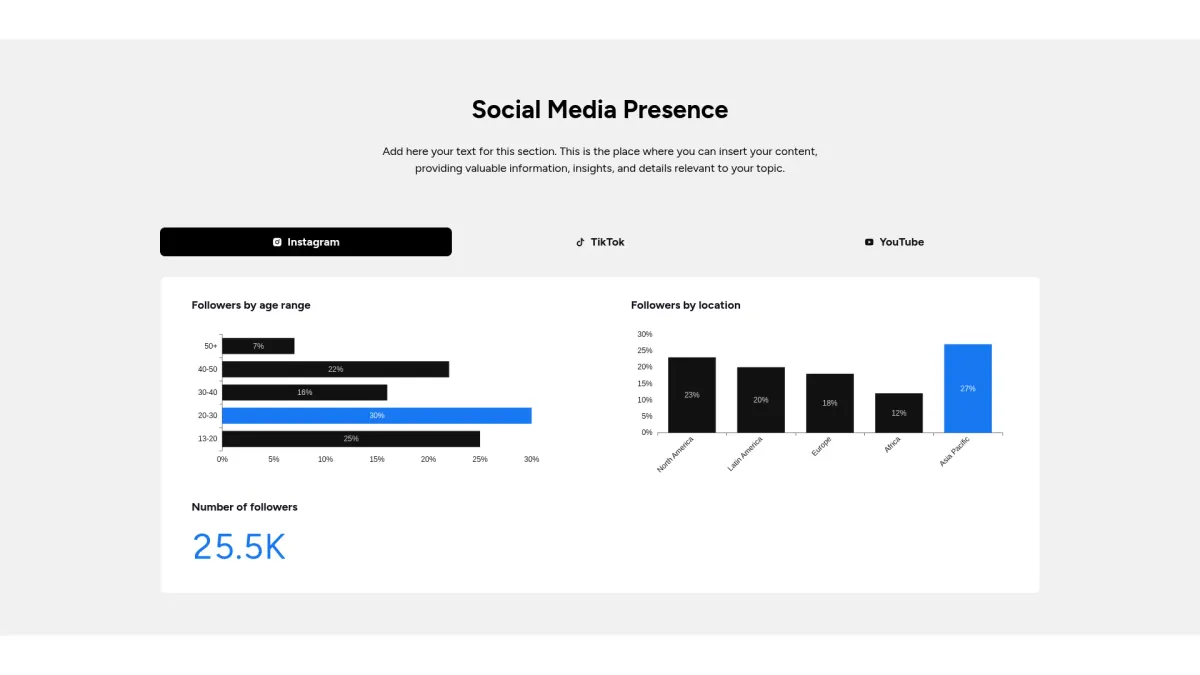
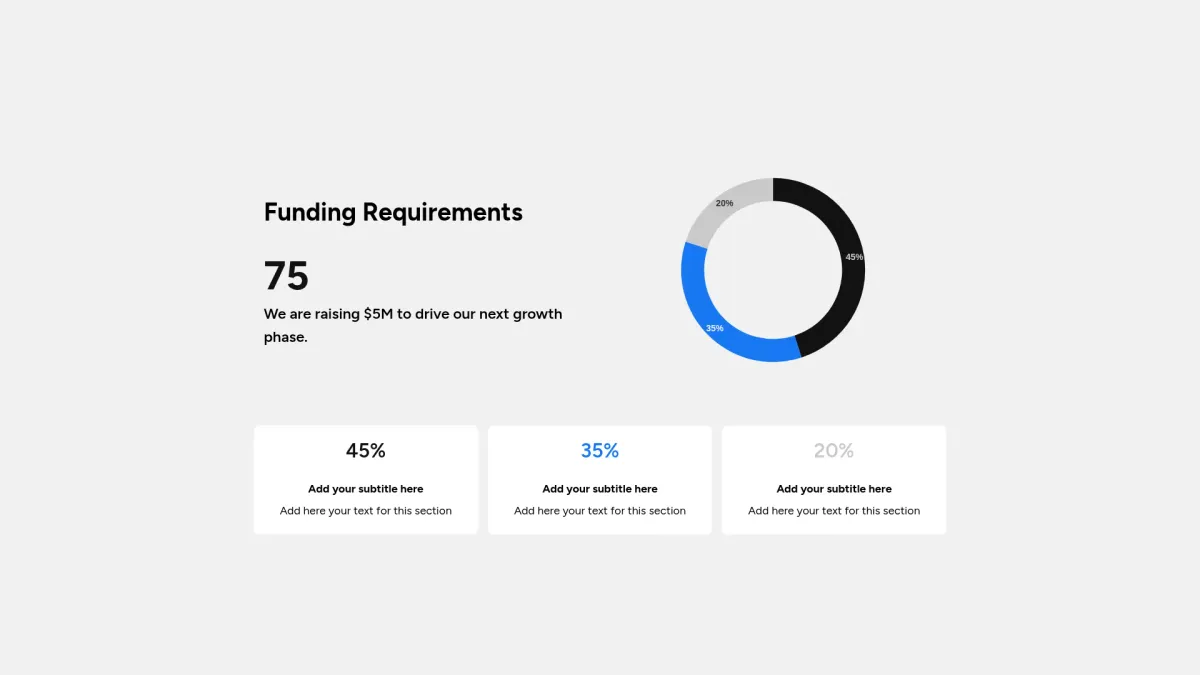
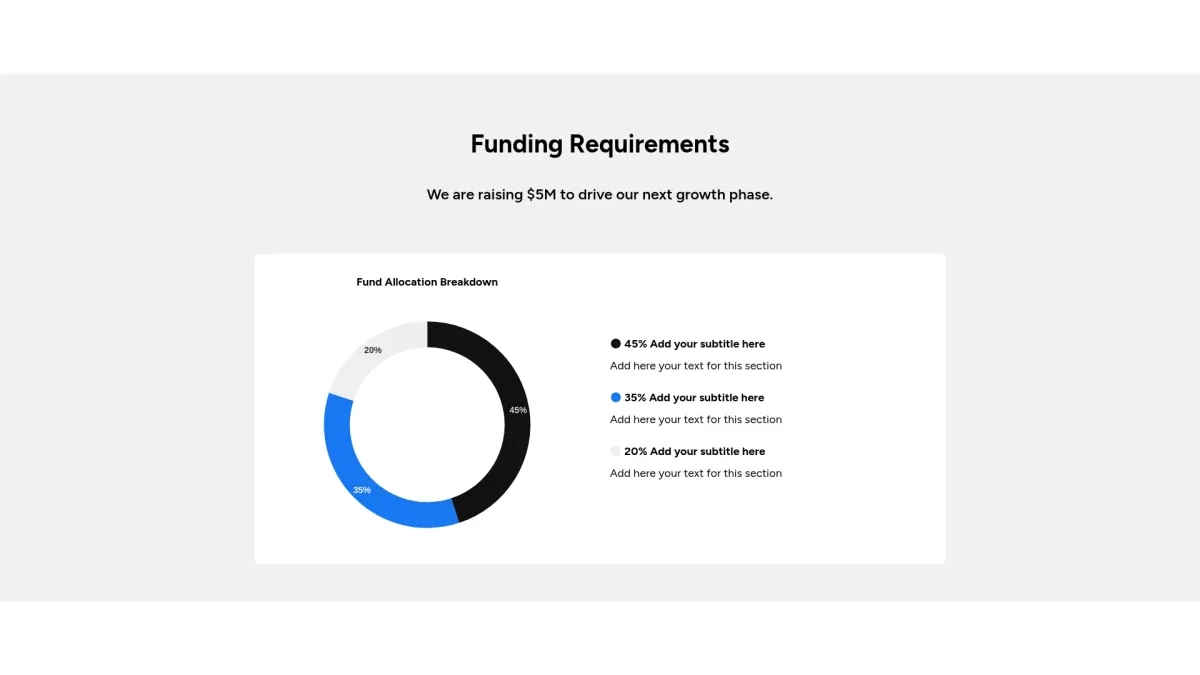
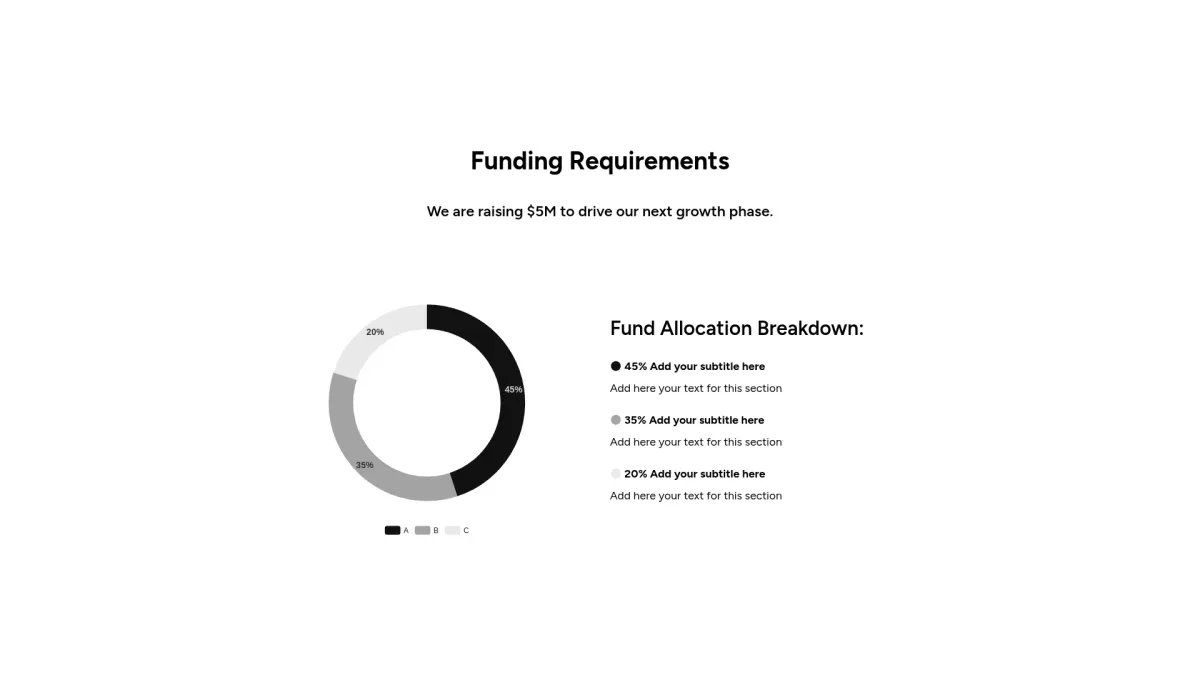
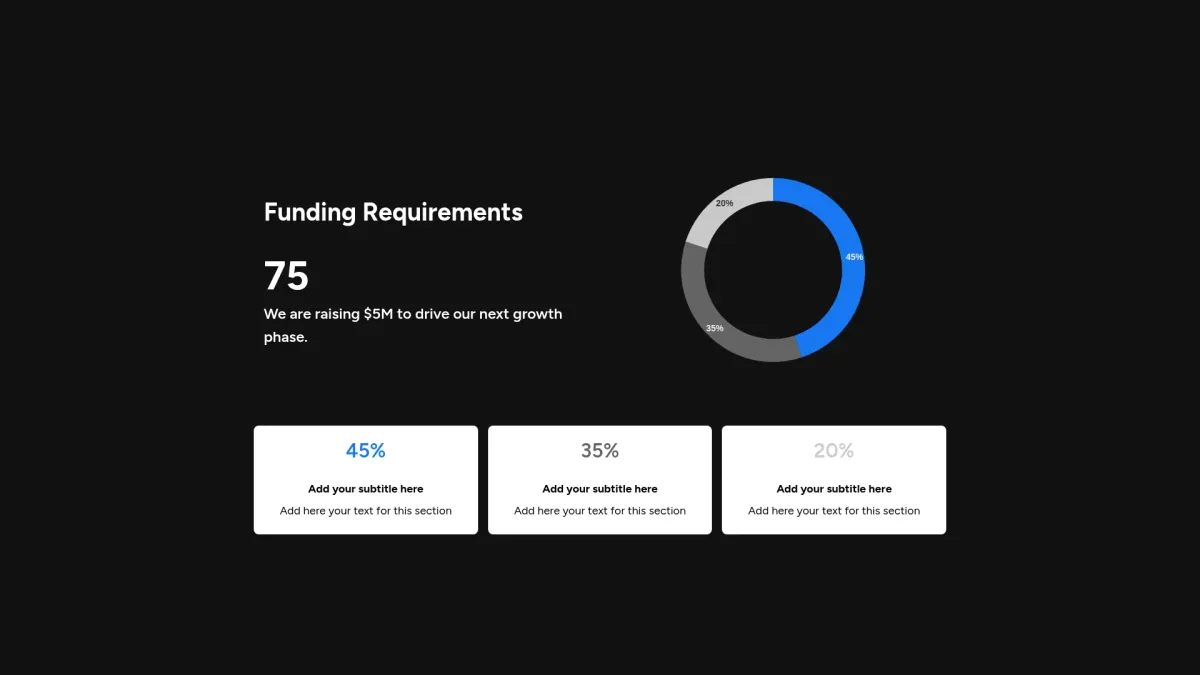
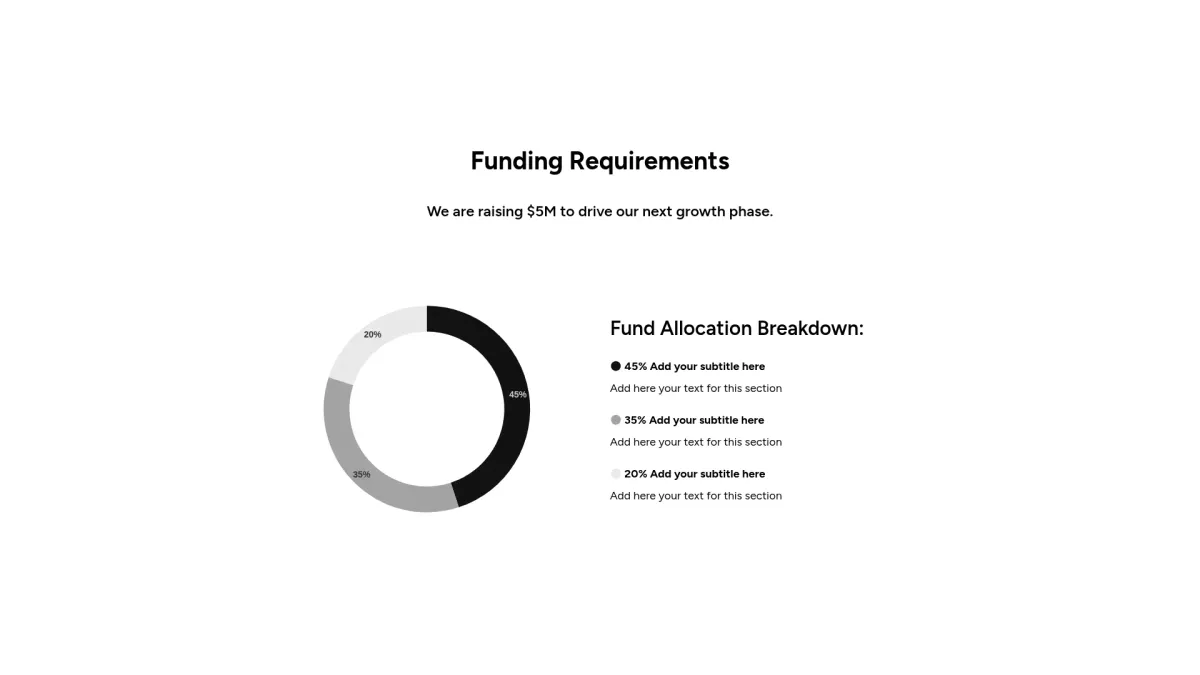
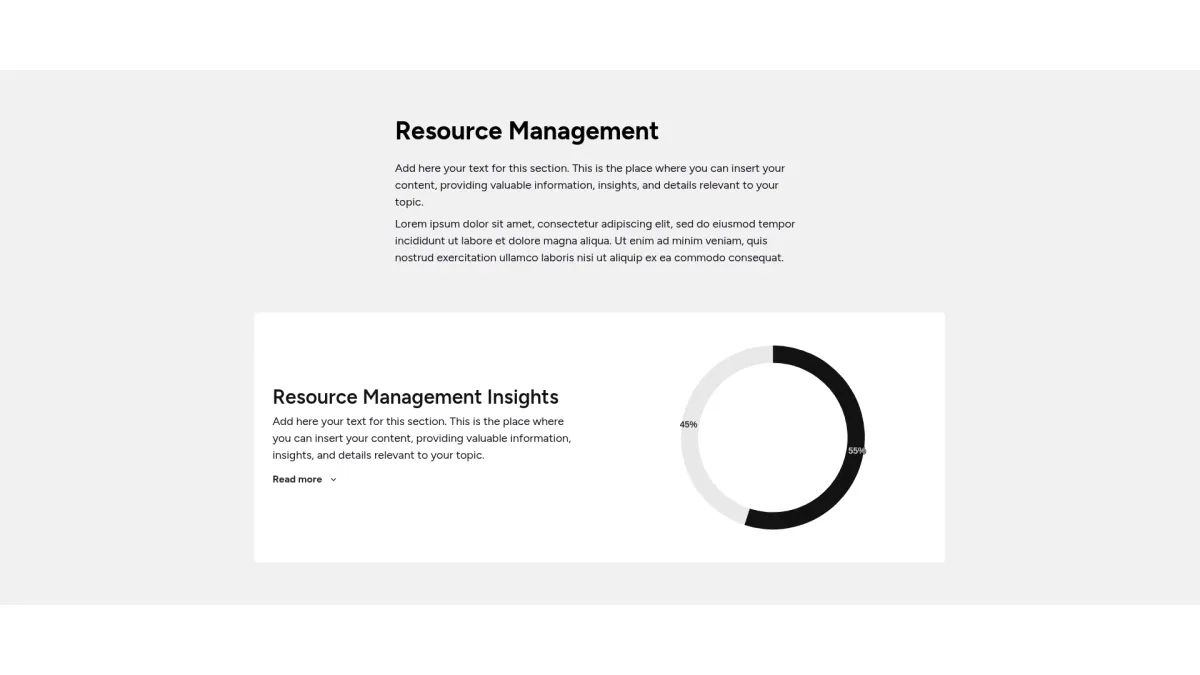
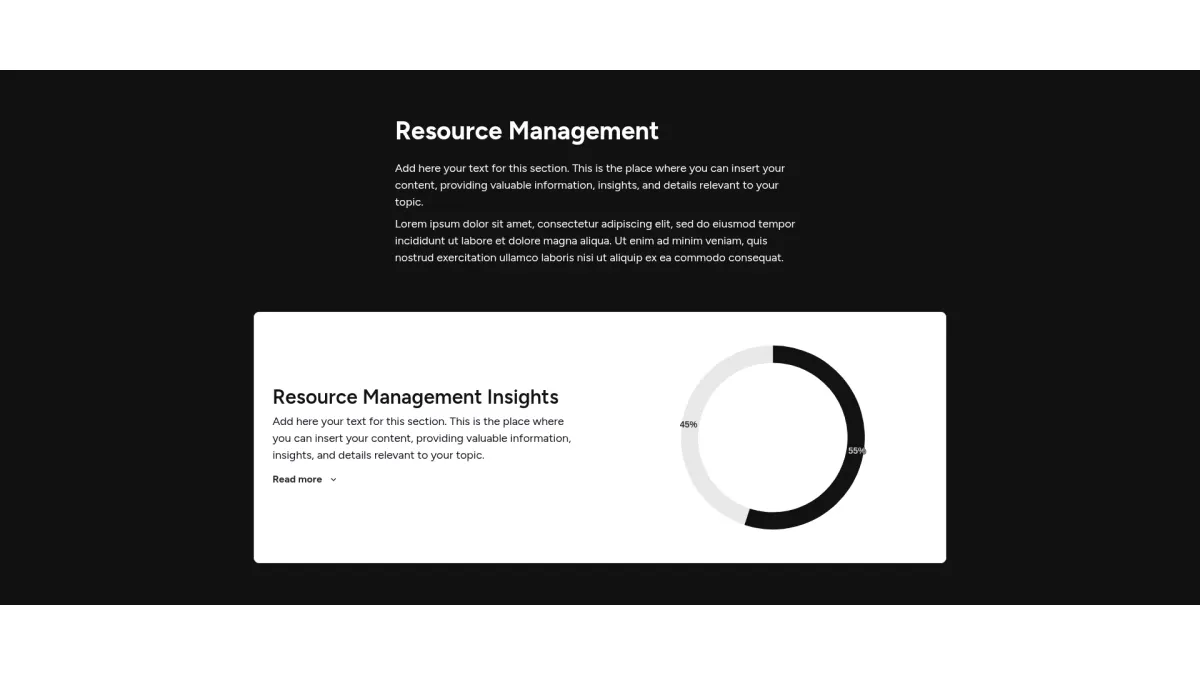
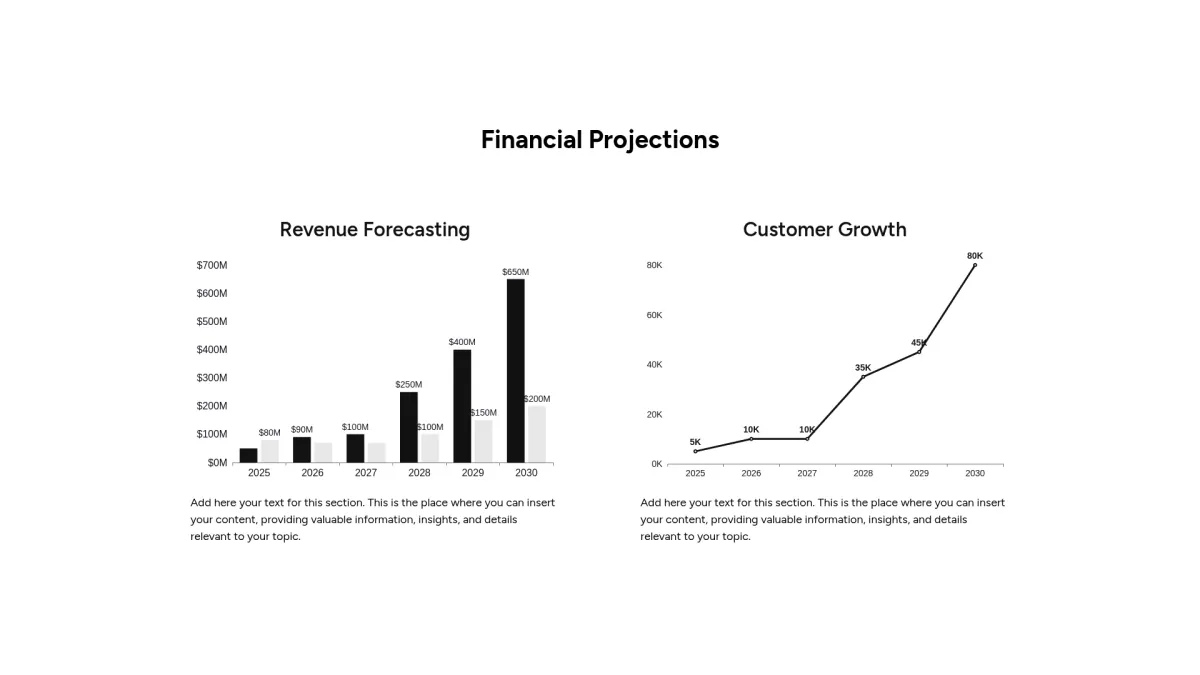
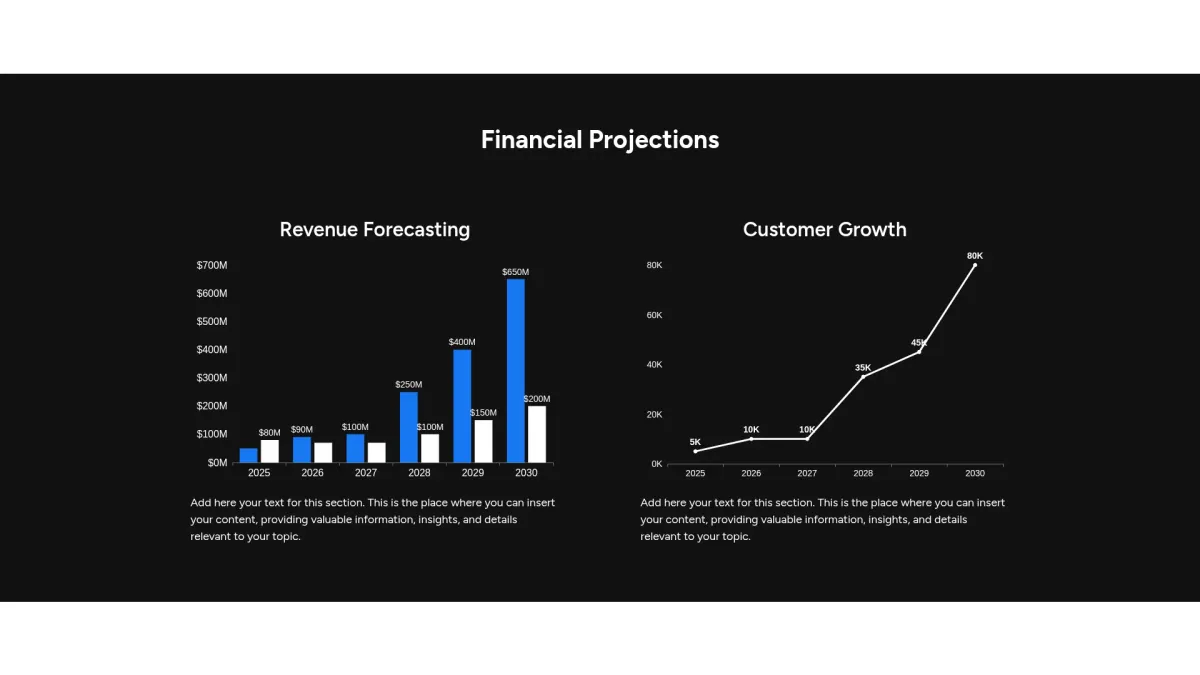
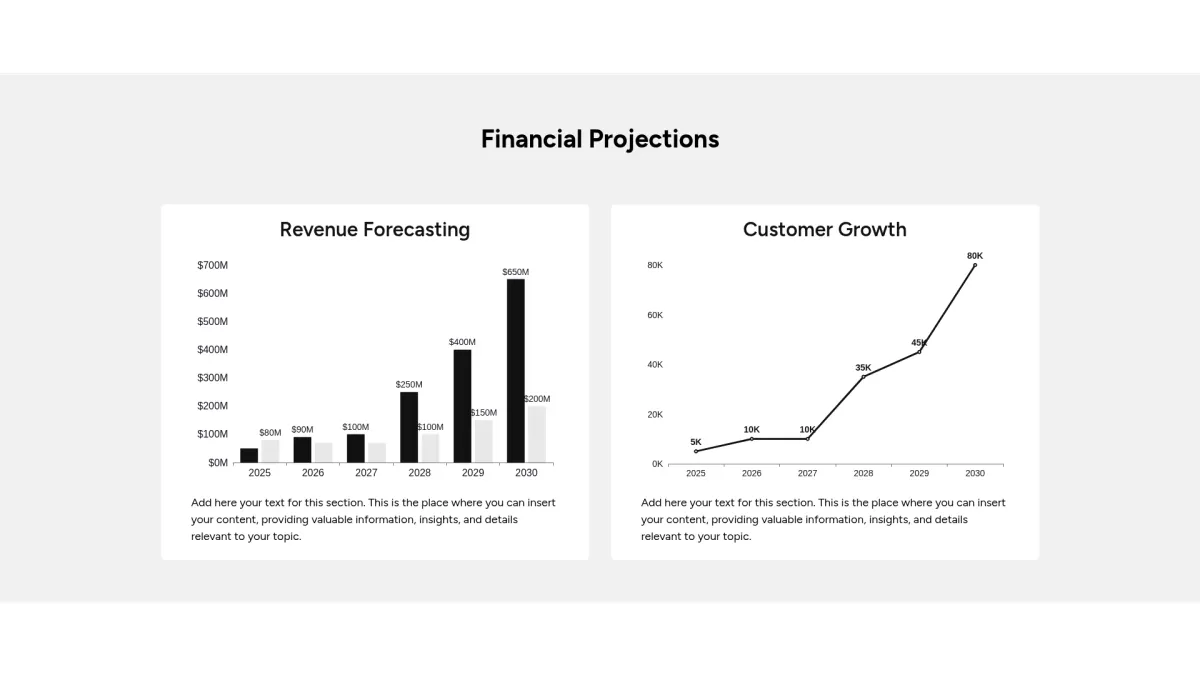
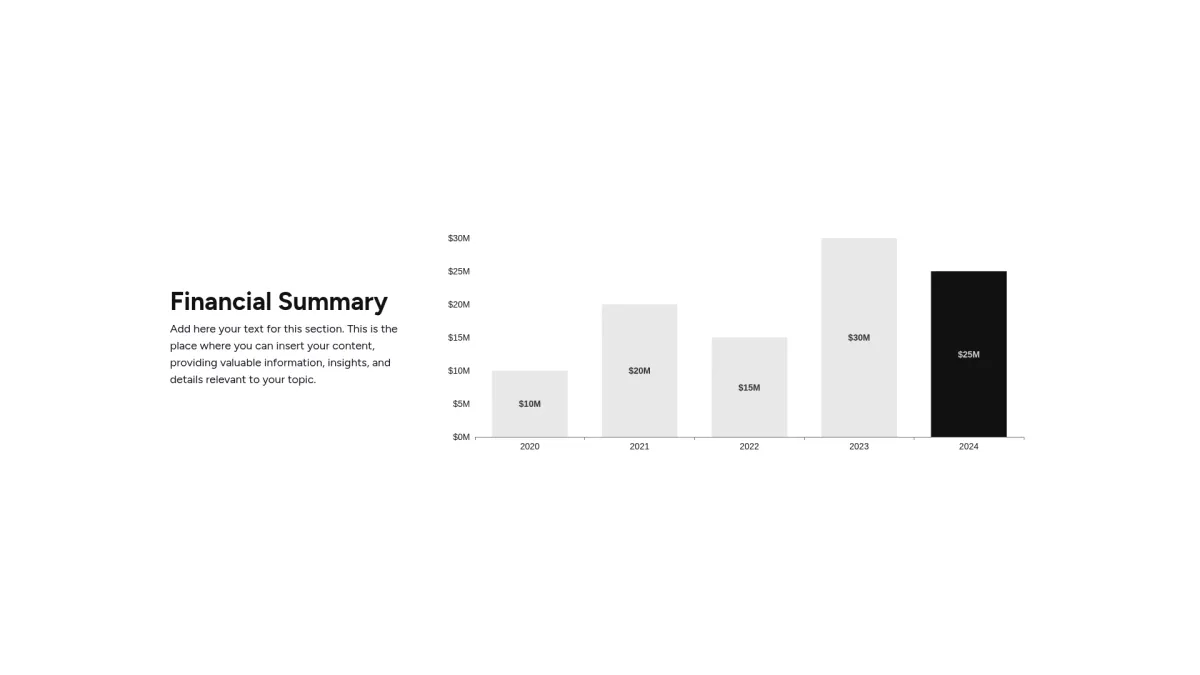
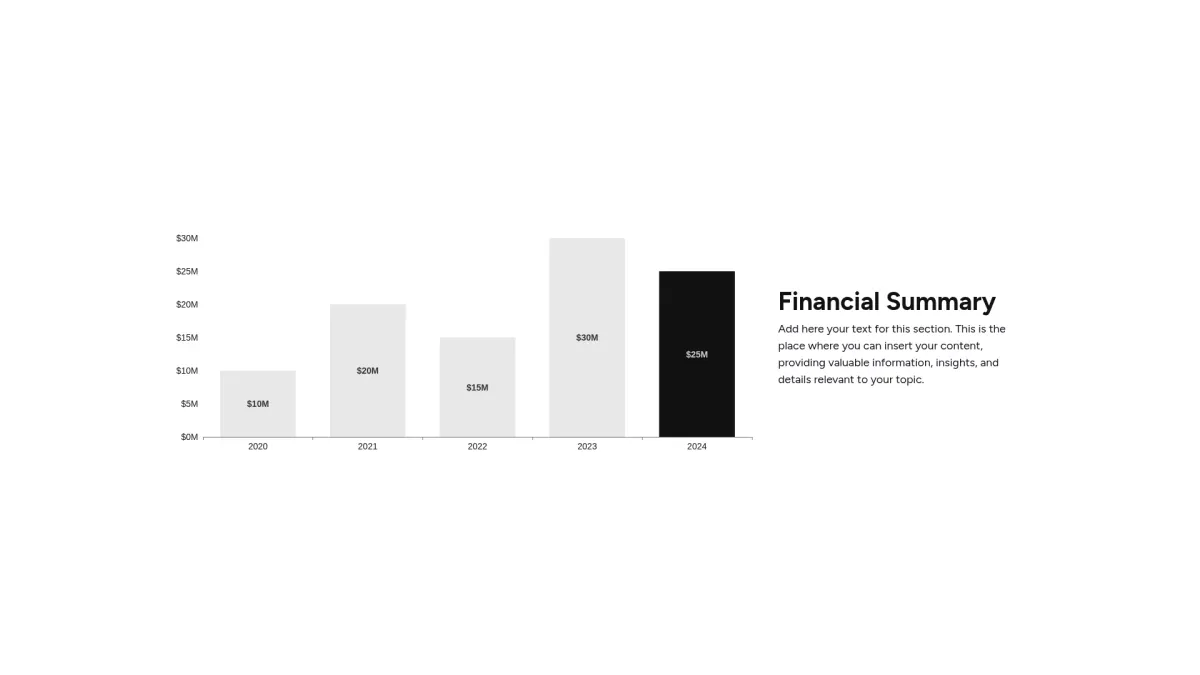
General chart slide
Choose the general chart slide layout you love most. Grab an interactive template that clarifies complex data and boosts strategic decision making.
Customize slide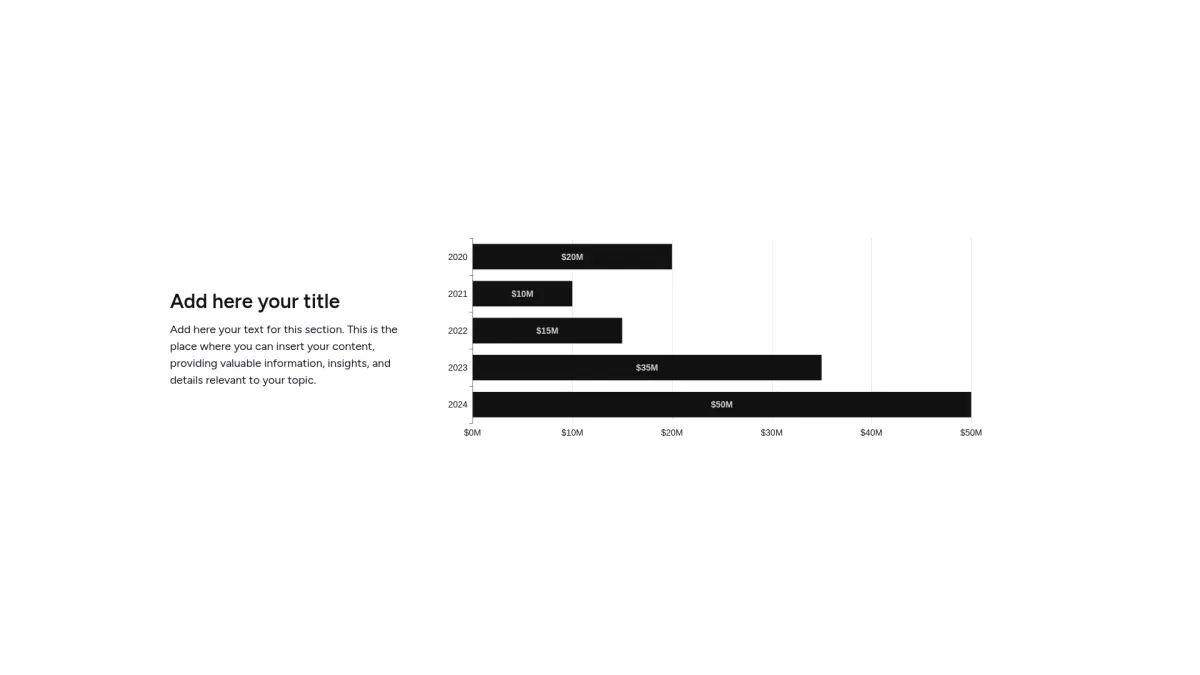
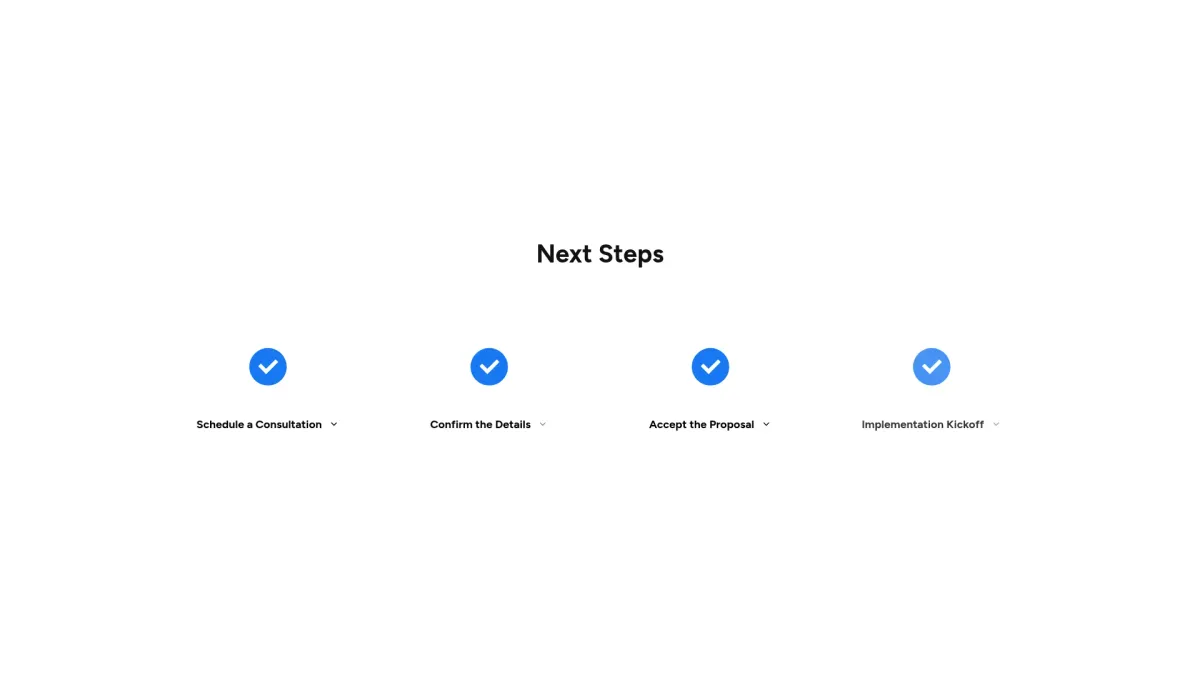
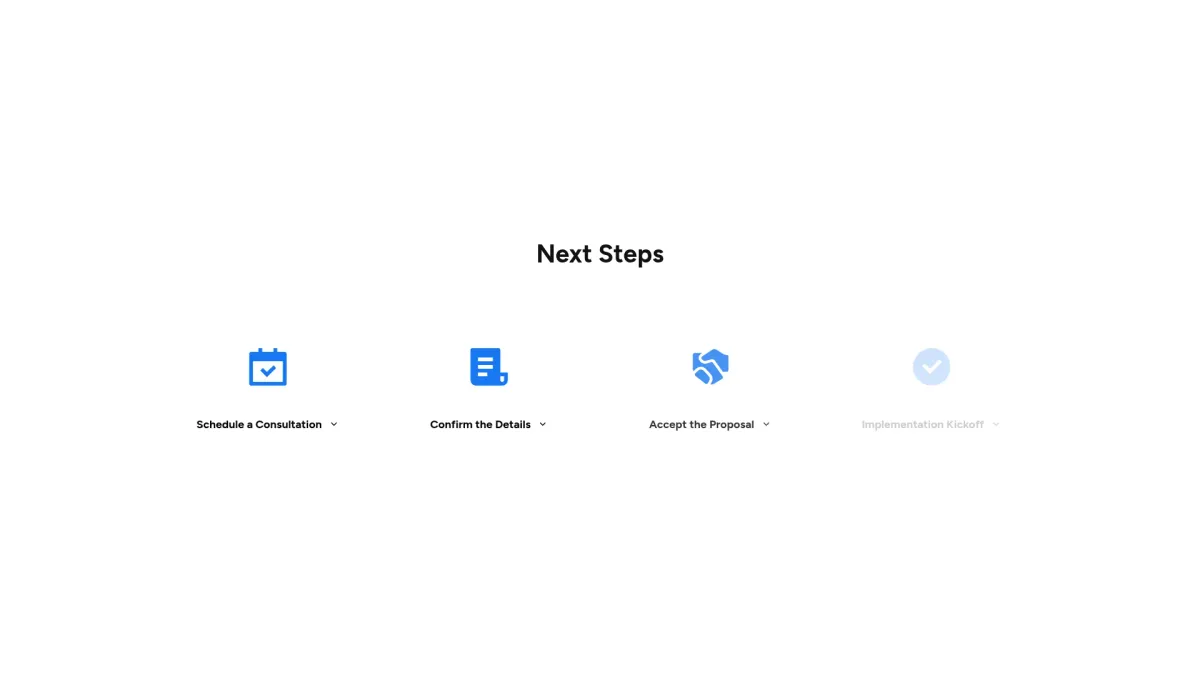
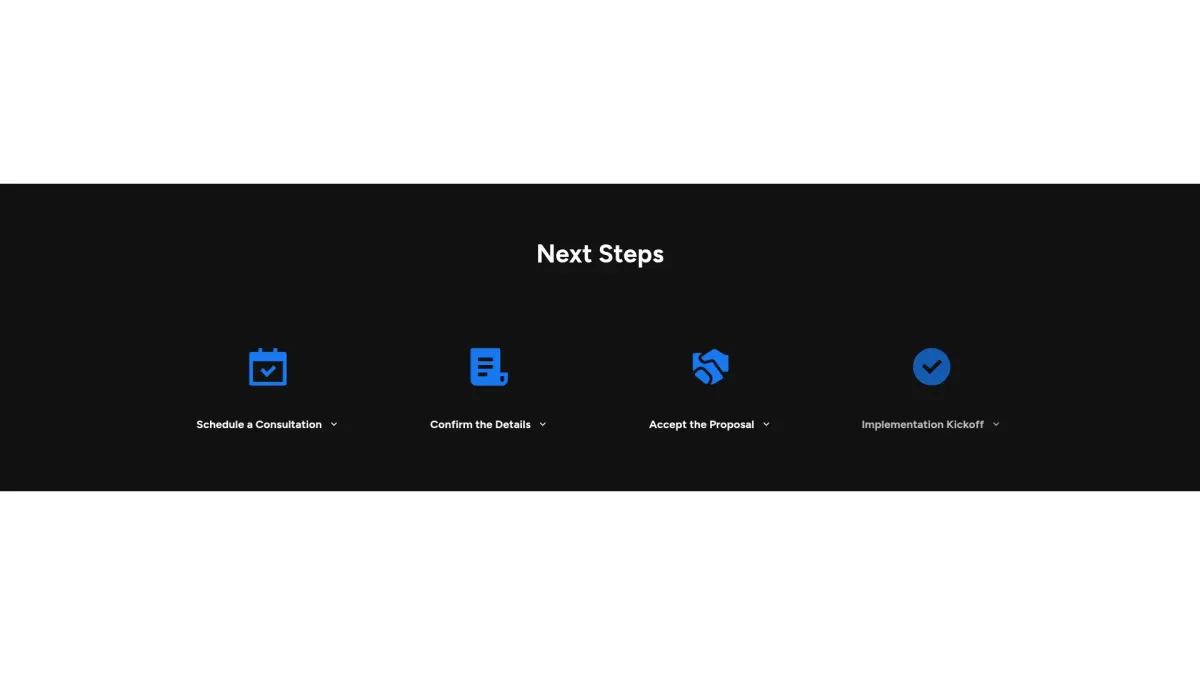
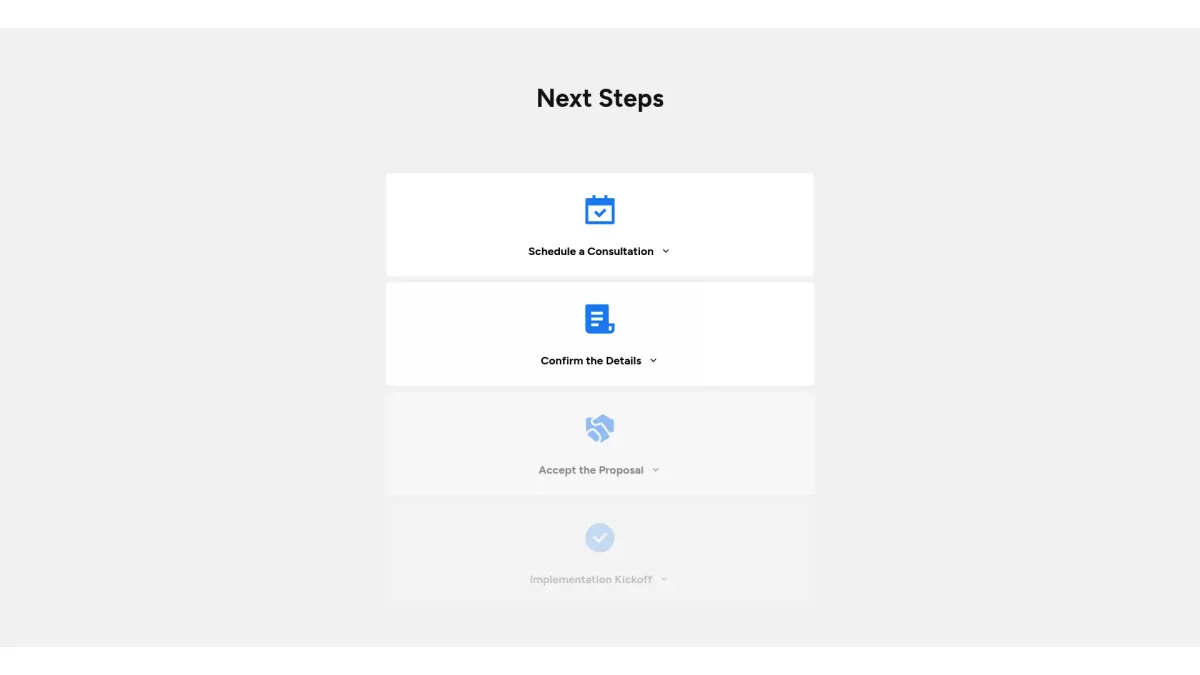
General timeline slide
Choose the general timeline slide layout you love most. Grab an interactive template that streamlines planning and clarifies communication.
Customize slide
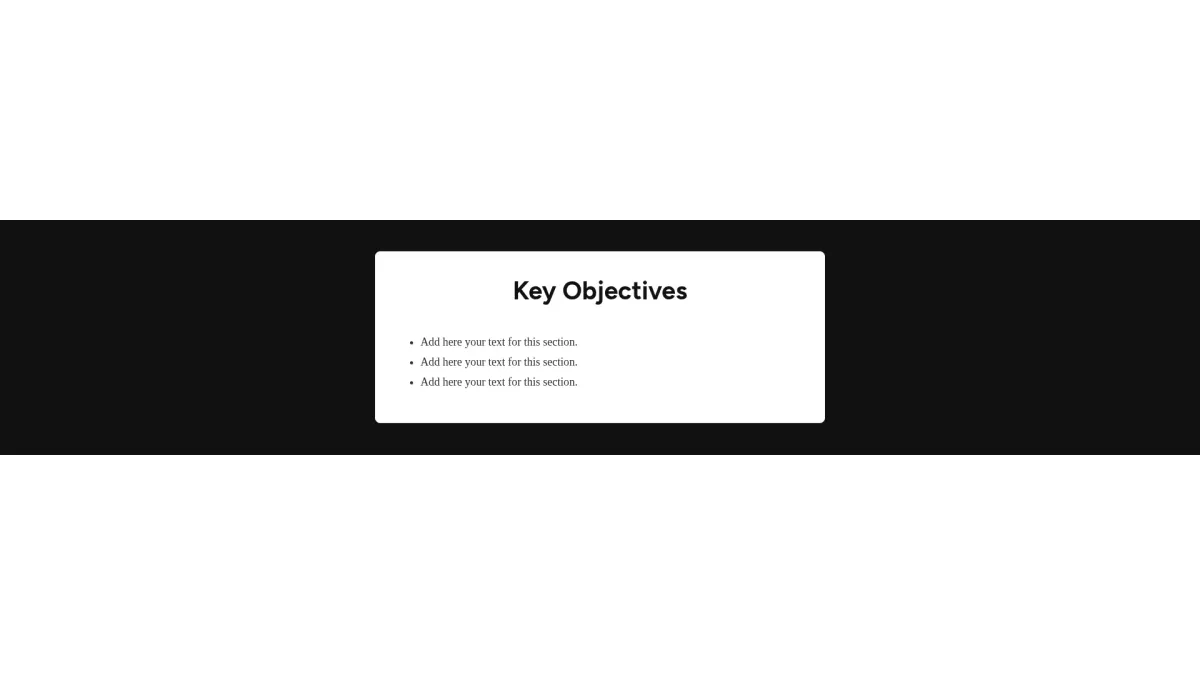
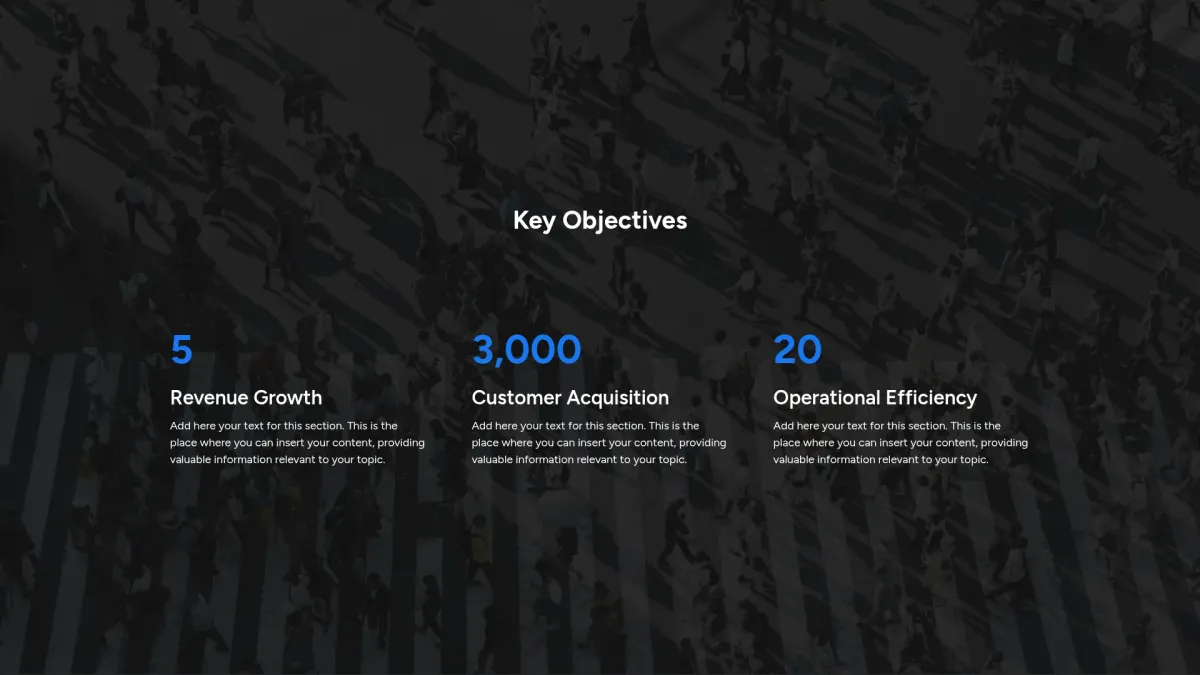
Objectives slide
Choose the objectives slide layout you love most. Grab an interactive objectives slide template that enhances your strategic focus for better results.
Customize slide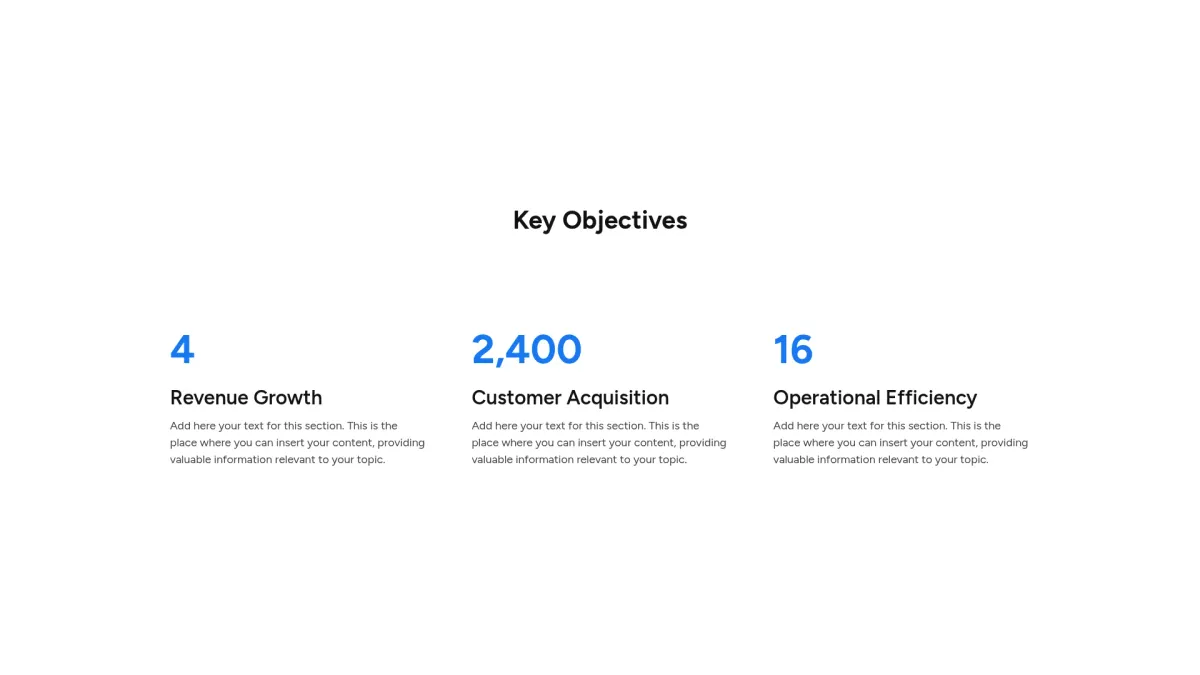
Target audience slide
Choose the target audience slide layout you love most. Grab an interactive template that sharpens audience focus and boosts strategic messaging.
Customize slide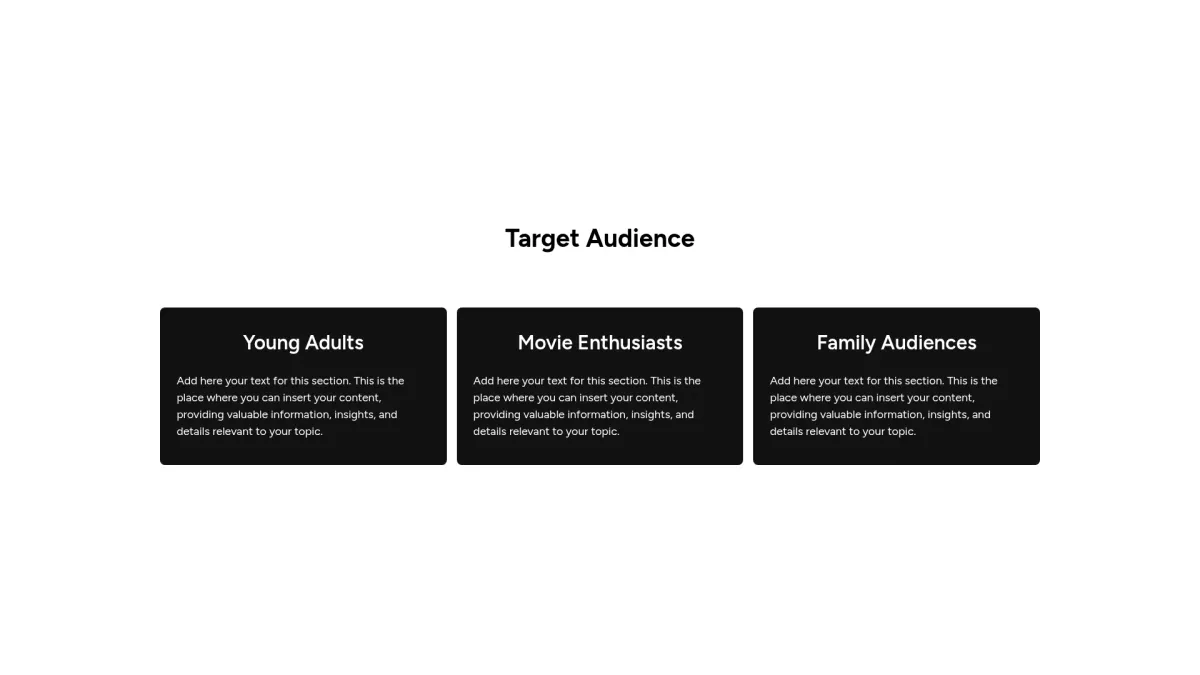
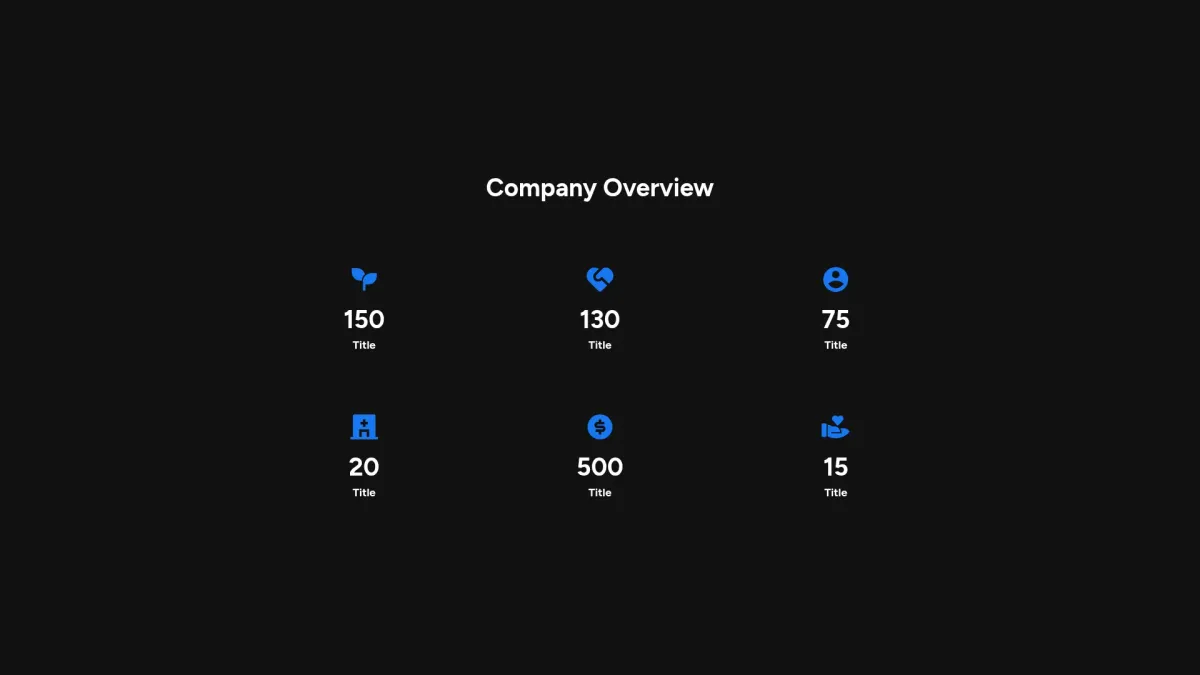
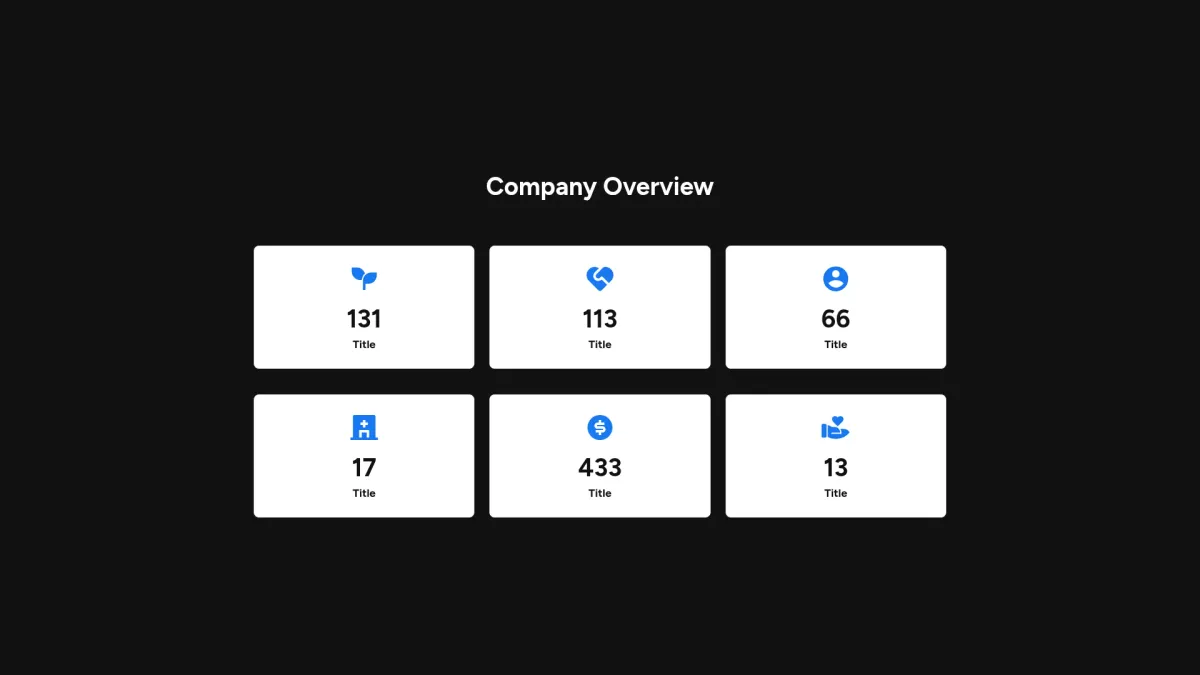
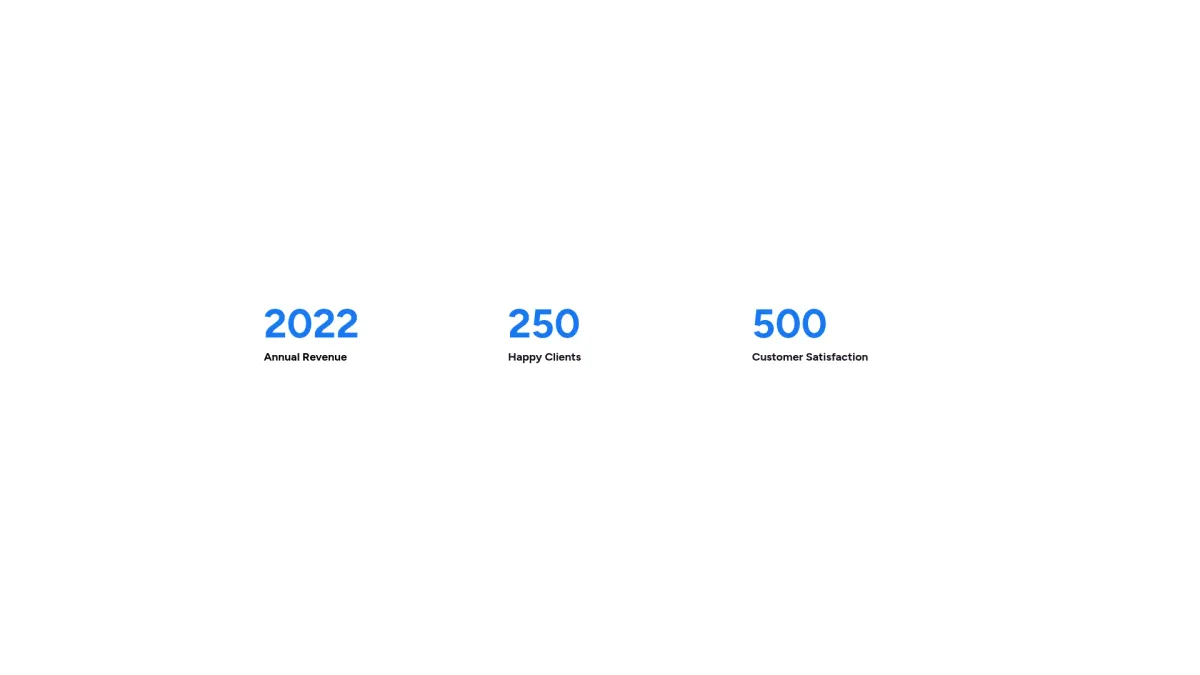
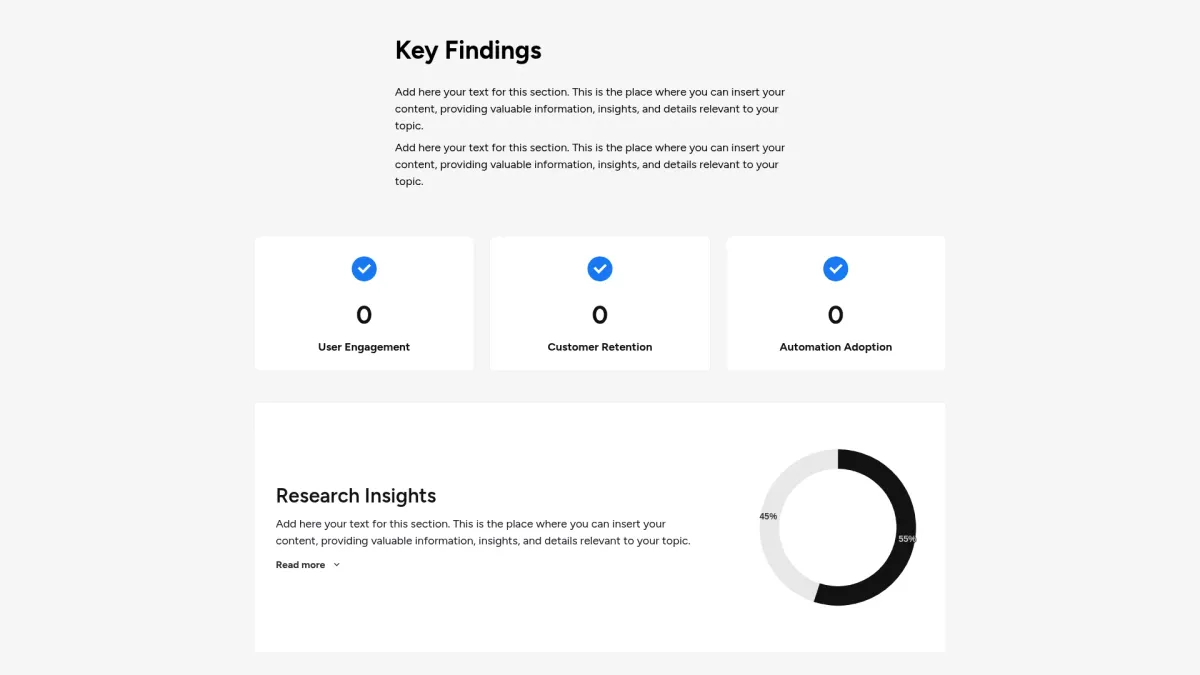
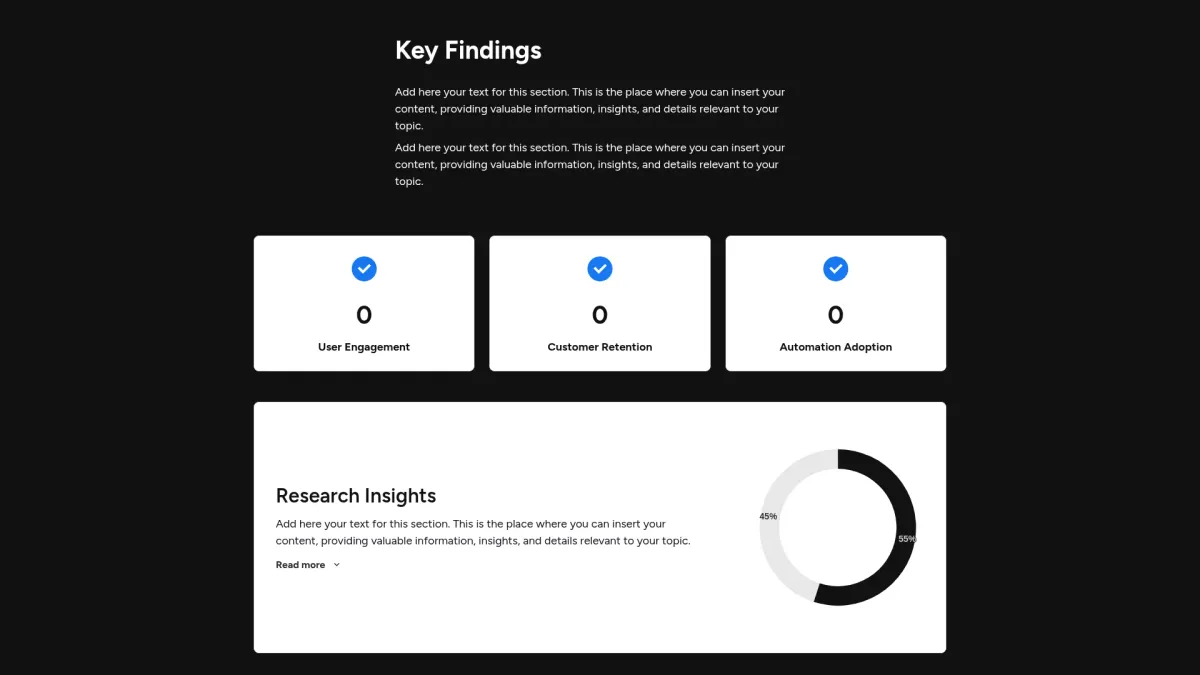
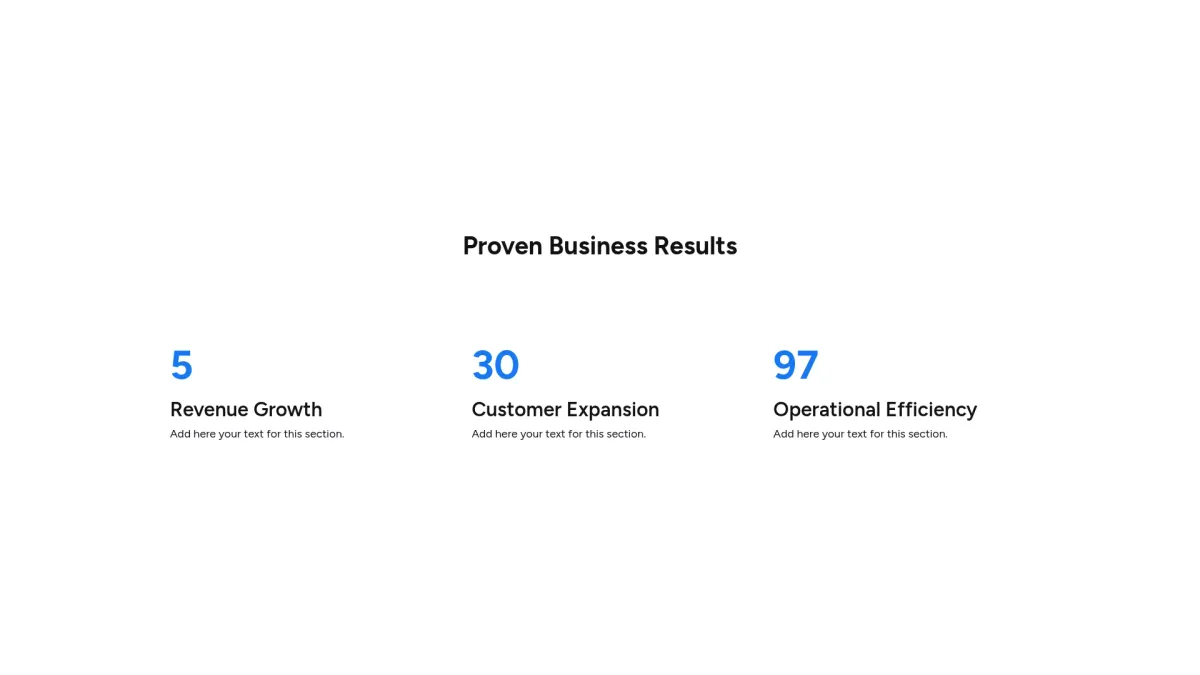
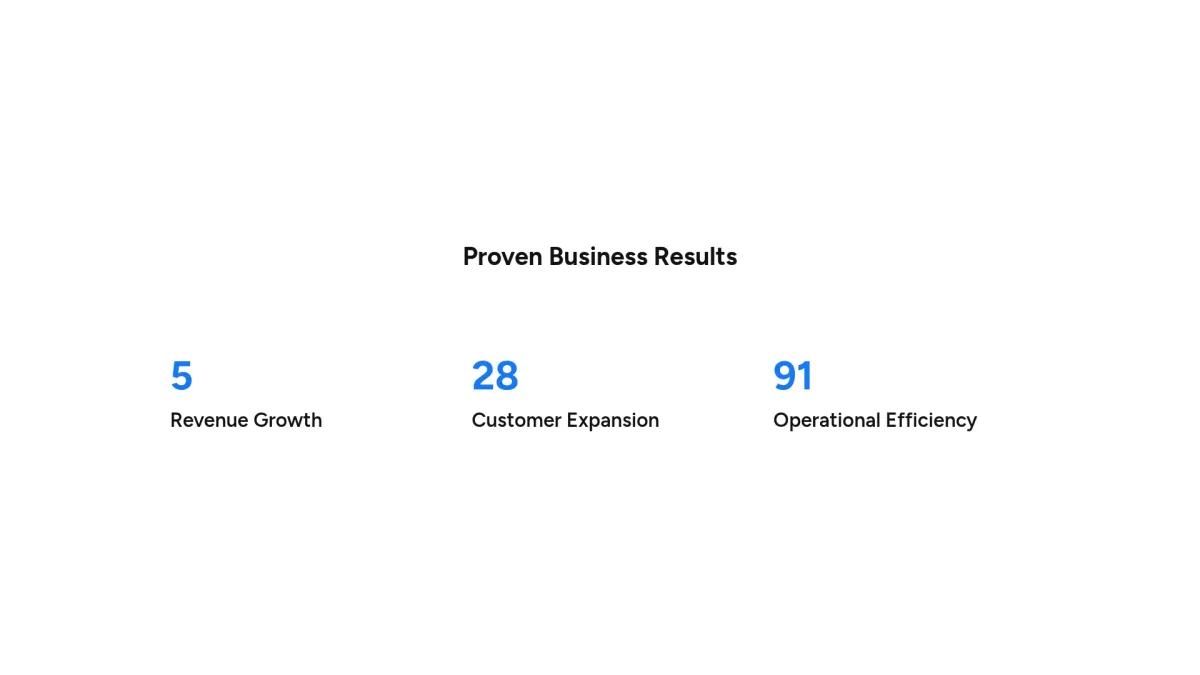
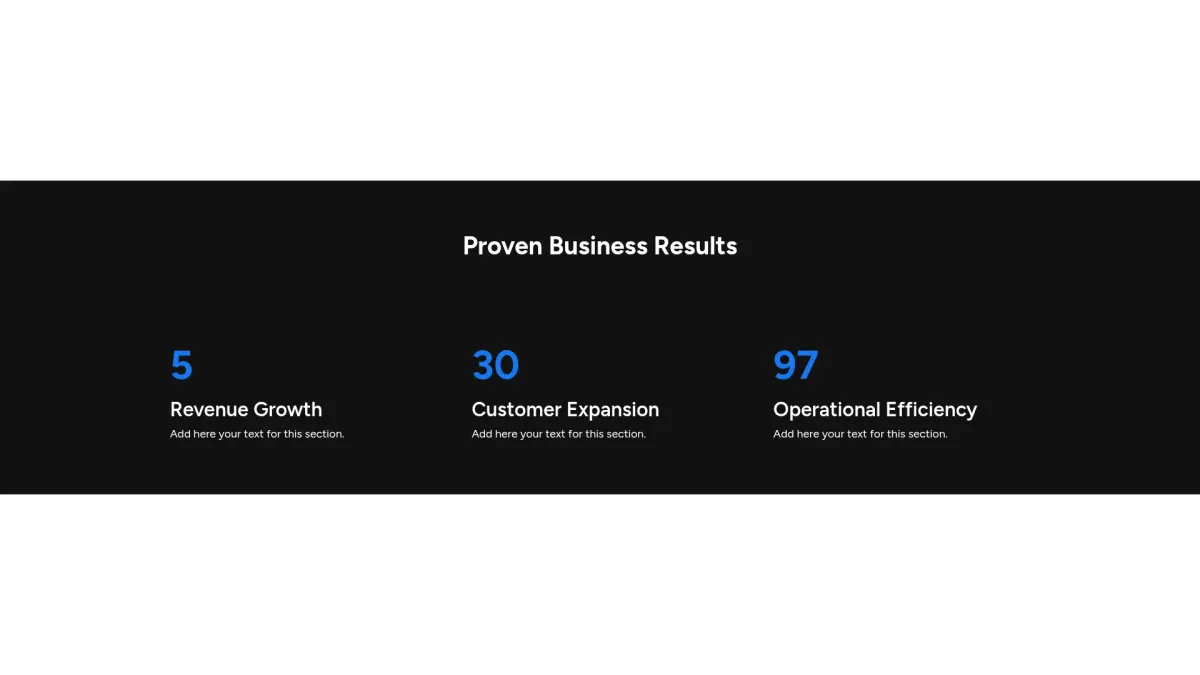
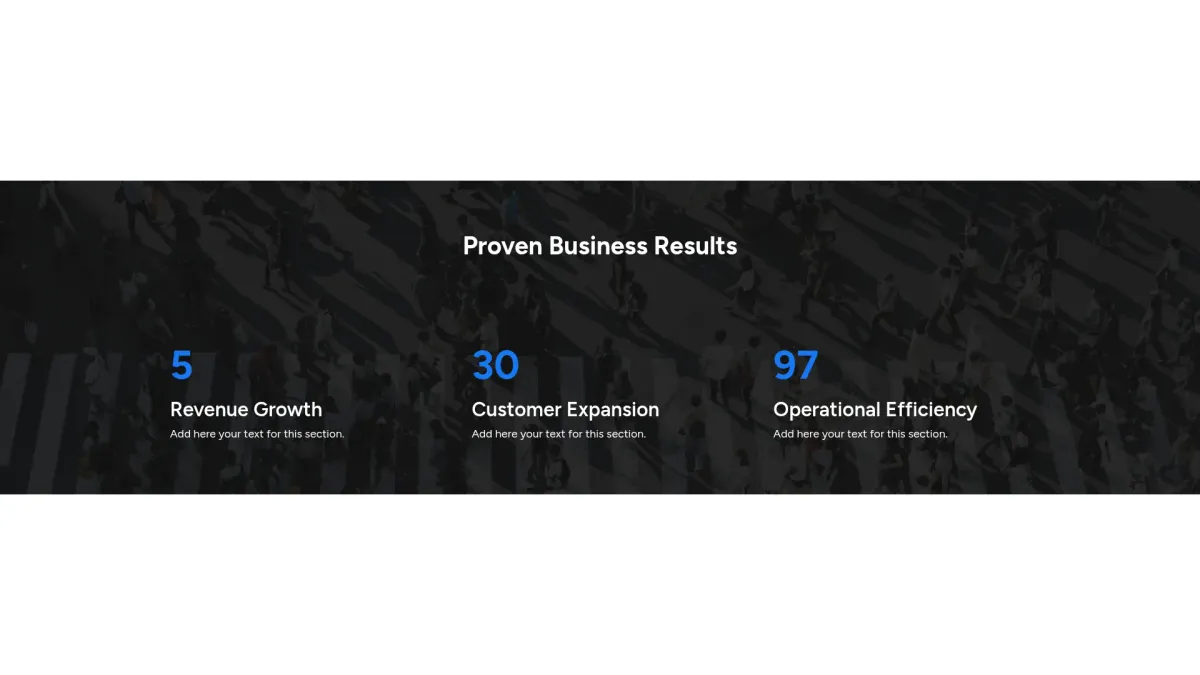
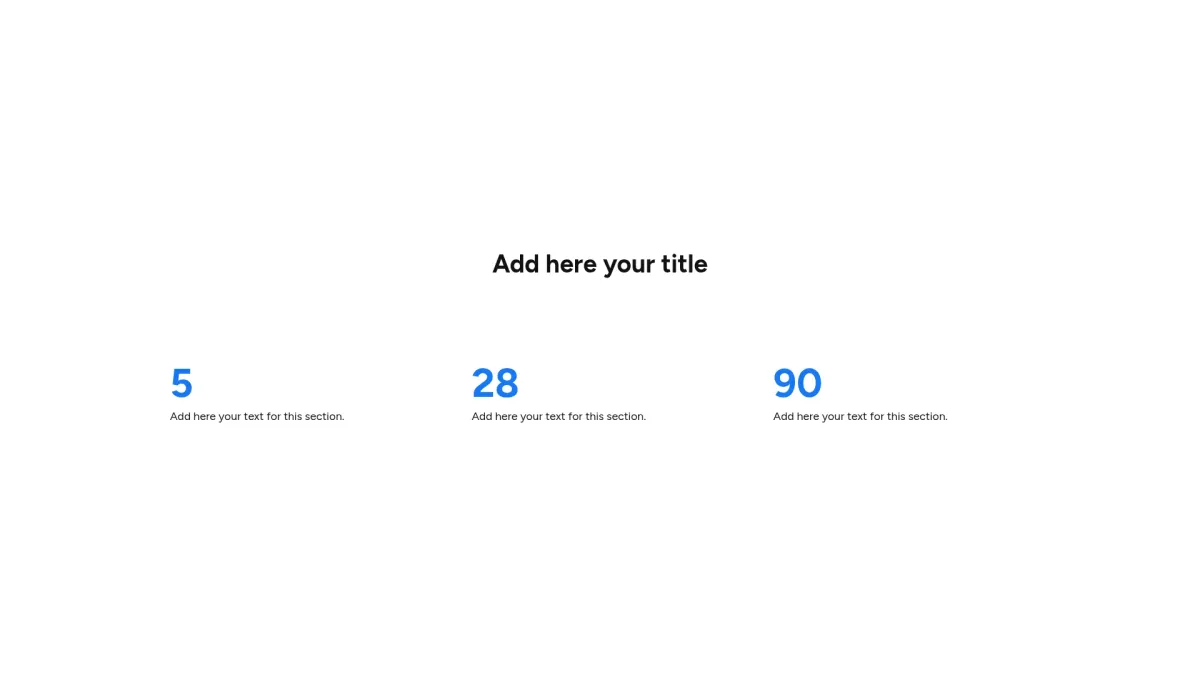
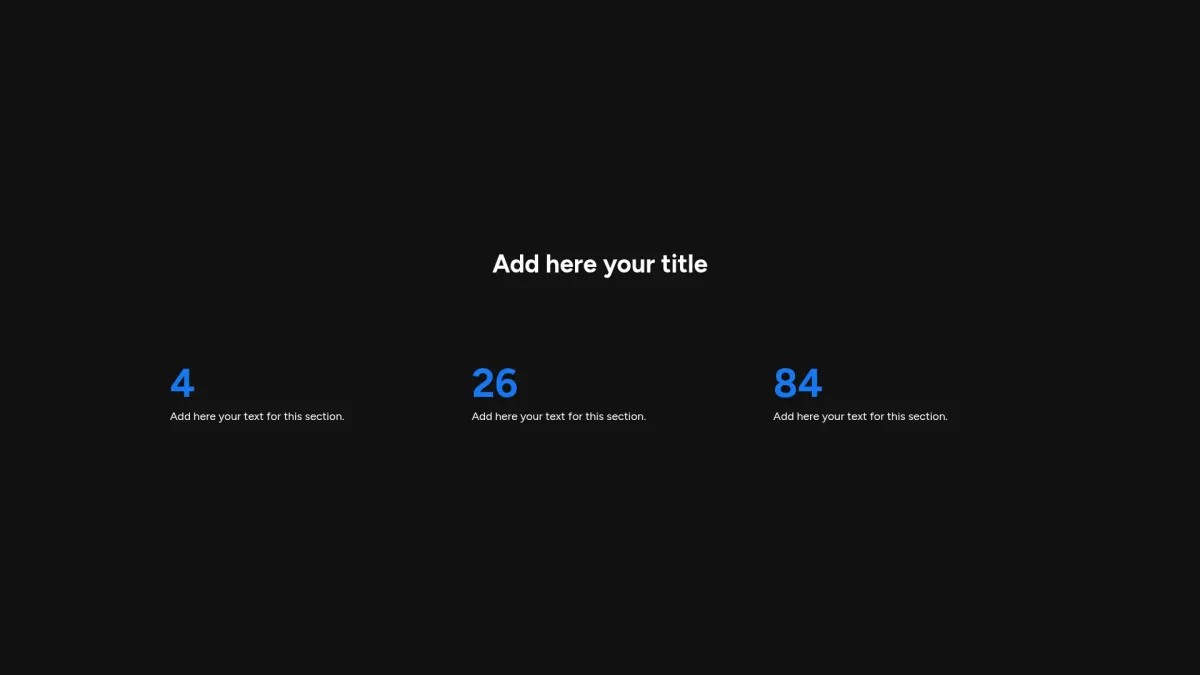
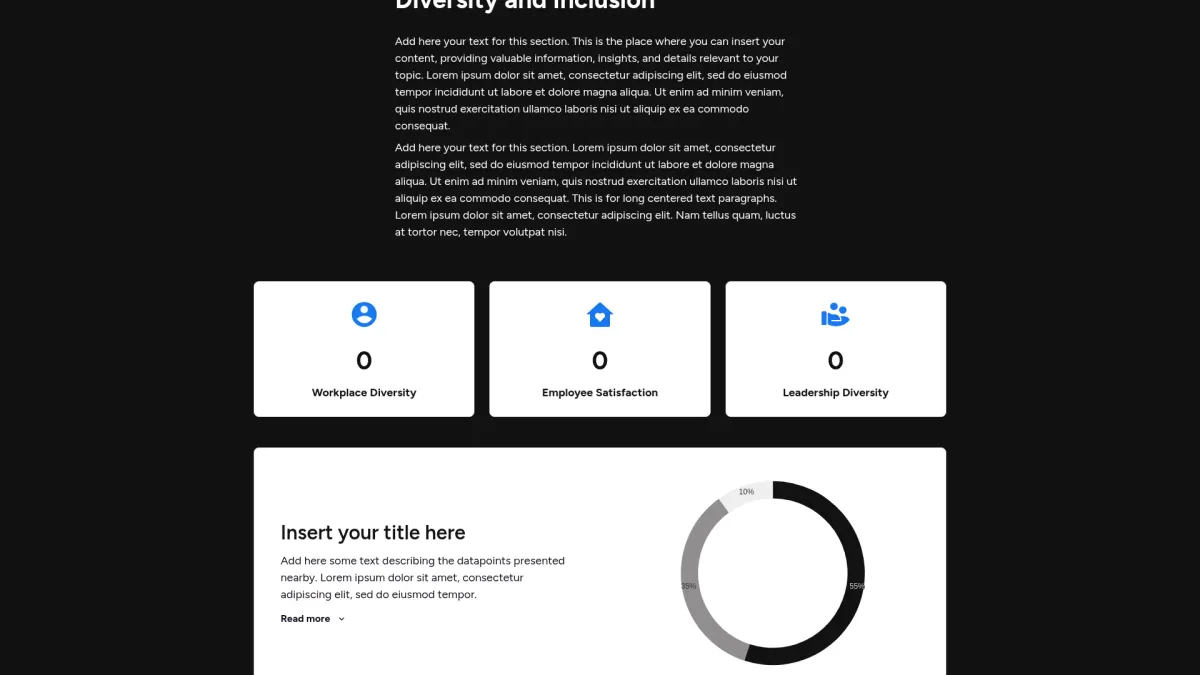
Company in numbers slide
Choose the company in numbers slide layout you favor. Grab an interactive template that enhances clarity, increases engagement, and drives smart data decisions.
Customize slide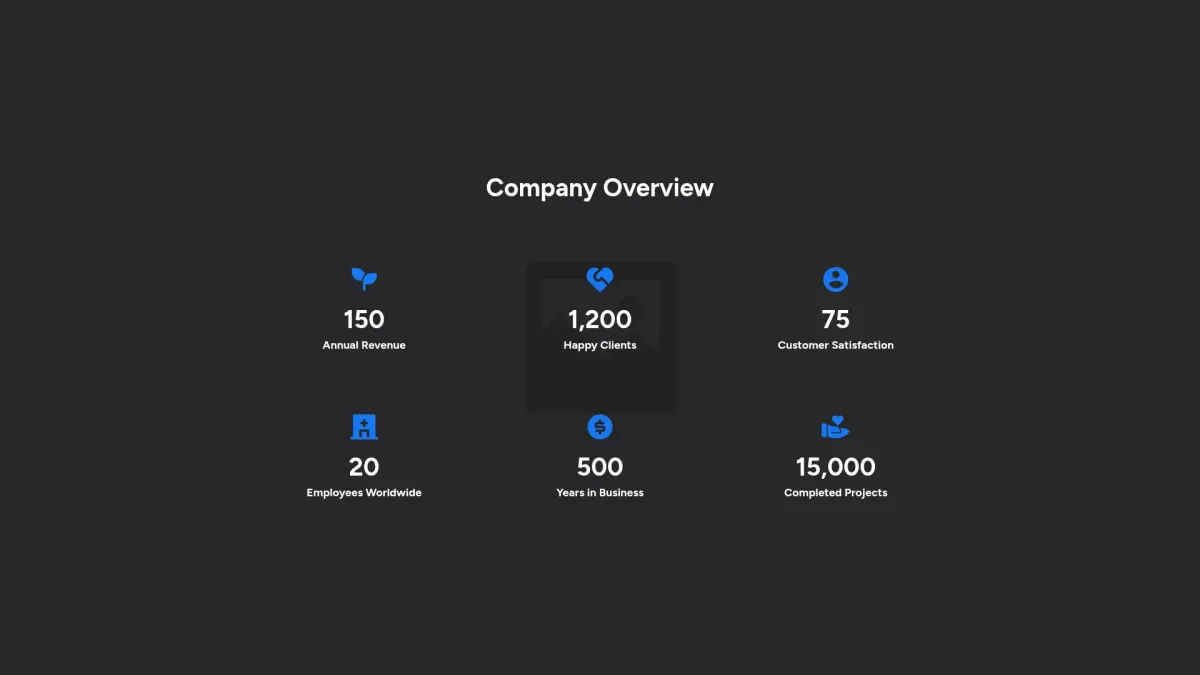


FAQ
What are data slides?
What are data slides?
Data slides are customizable presentation templates designed for effective data communication. They serve as dynamic visual aids that automate writing and design, catering to business professionals, marketers, and analysts. These templates are used in board meetings, reports, pitches, and strategic planning across various industries including finance, technology, and healthcare globally.
What is the goal of data slides?
What is the goal of data slides?
The goal of data slides is to empower you with automated, visually engaging templates that simplify complex data presentations. They provide clear, structured formats to enhance communication, decision-making, and strategic planning for business environments effectively.
What do data slides templates include?
What do data slides templates include?
A data slides template typically includes:
- Title area with clear slide header
- Data visualizations with interactive dynamic charts
- Content blocks with concise information structure
- Automated AI writing provides tailored content
- Design sections adjustable for brand consistency
These comprehensive elements enable effective presentation storytelling for business success. Guaranteeing professional visual impact.
How to tailor your slide with AI?
How to tailor your slide with AI?
After selecting your desired data slides, use Storydoc’s numerous layouts to guide AI in generating customized content and design. Write a precise prompt to direct automated writing and design, adjust colors, fonts, and sections, and download or edit within the interactive Storydoc editor for optimal slide creation meeting your needs.
What makes Storydoc slides better than static slides?
What makes Storydoc slides better than static slides?
Storydoc slides offer significant benefits:
- Interactive functionality enhancing user engagement remarkably.
- Drag-and-drop editing enables effortless adjustments quickly.
- AI customization delivers precise slide content.
- Personalization options reflect your brand accurately.
- Automated design streamlines creative process efficiently.
- AI assistants support prompt content generation.
- Advanced analytics improve data-driven decisions significantly.
Experience results immediately.
Why use Storydoc instead of paying an agency?
Why use Storydoc instead of paying an agency?
Storydoc slides outperform agency designs by offering double engagement at lower costs. You create slide decks up to five times faster without tedious revisions, maintaining complete control over content updates and security. This automated platform simplifies customization and enhances collaboration, reducing time and resources required for professional presentations with excellence.
Start working on your data slides with our AI presentation maker

Make data slides that get the job done
Stop losing opportunities to ineffective documents.
Try Storydoc now.